
Third Quarter NHL Betting Report
Third Quarter NHL Betting Report

The third quarter of the 2023/24 season (henceforth referred to as Q3) wrapped Monday, as we sprint towards the fast-approaching finish line. This was a whirlwind quarter for my weekly reports in terms of constant model construction, retrofitting, lather, rinse, repeat, that much of my reporting was explaining changes to the information feeding all the betting picks provided. There was far less discussing big picture macro analysis than previous seasons. There were some growing pains figuring out which of these new advisors was dispensing the best advice, but not for over/under. Abandoning a singular algorithm for a 5-member team all with different approaches and sustained competence produced tremendous results.
Before we go any further, it’s time for my obligatory *DISCLAIMER* it needs be noted that I’m not betting with real money. These are all fictional wagers in a spreadsheet. My mission is to engage in a mass betting campaign, picking a winner of every single game, every over/under, because it provides a complete dataset for macroeconomic analysis, which can be shared with you, shedding light on what worked and what failed. I’m also tracking the results of betting every outcome, to help me (and you) uncover previously unknown or newly emerging profit vectors. What started as a thought experiment has evolved into much more.
My 1st Quarter Profit: $ 1,305 (1.2% return)
My 2nd Quarter Profit: $4,376 (3.9% return)
My 3rd Quarter Profit: $4,056 (3.4% return)
Without the San Jose Sharks, my first quarter would have been a net loser, getting hit hard on over/under, activating my primary algorithm just as unders were shifting from red hot to ice cold. Second quarter there were a few teams I hooked my trailer to on their way up and down, betting more conservatively, avoiding -1.5 in lieu of dogs +1.5, grinding out a 3.9% return. Slowly more models were trickling into the rotation, as early versions, prospered, languished, collapsed, from peaks to valleys week-to-week. By Q3, the evolution of my model construction techniques improved considerably, undertaking a mission to refit every model to larger samples.
Trying to manage the advice you’re getting from 15 different advisors (not including over/under) is tricky, especially when some of them are new, don’t have established track records, or prove themselves to be very volatile, capable of erratic swings in any direction. Towards the end of Q3, the idea came to group all the models according to themes, then paying closer attention to how each index performs with certain wagers, identifying which advice is best to take. Expected goals struggled -1.5 goals, but excelled +1.5 goals. The very last model created (in less than 10 minutes) just as Q4 began was my new “Profit Aggregator” (like the Grand Aggregator, but only adding up picks producing profit last 30 days).
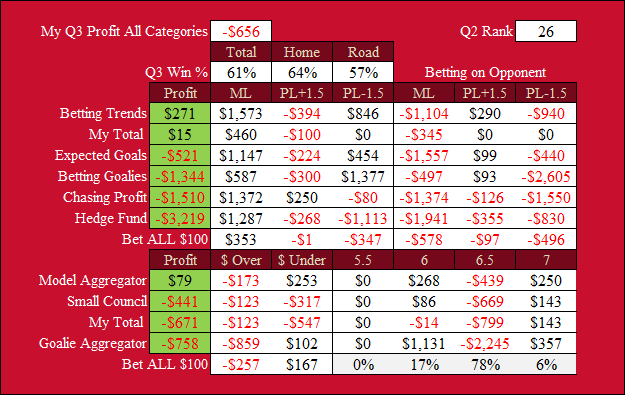
Third Quarter Results:
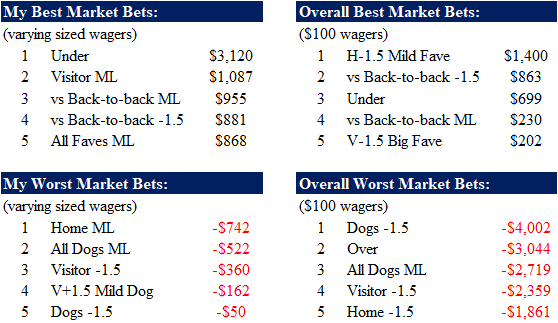
There were not very many profitable categories in Q3, which means that oddsmakers did a proficient job setting the lines at the optimal equilibrium, such that neither side had disproportionate profitability. This was less true in the case of over/under (which will be discussed below) as betting $100 on the under for every single game would have netted you $699 (at least on the opening lines at Draft Kings, closing lines it was $562 so the public tended to bet the lines favoring unders from open to close). Unders were my best category by a wide margin, but it can be a stressful bet to make when you’re watching the game. Back-to-backs were the other reliable category, aside from going 0-7 one week near the end of the quarter.
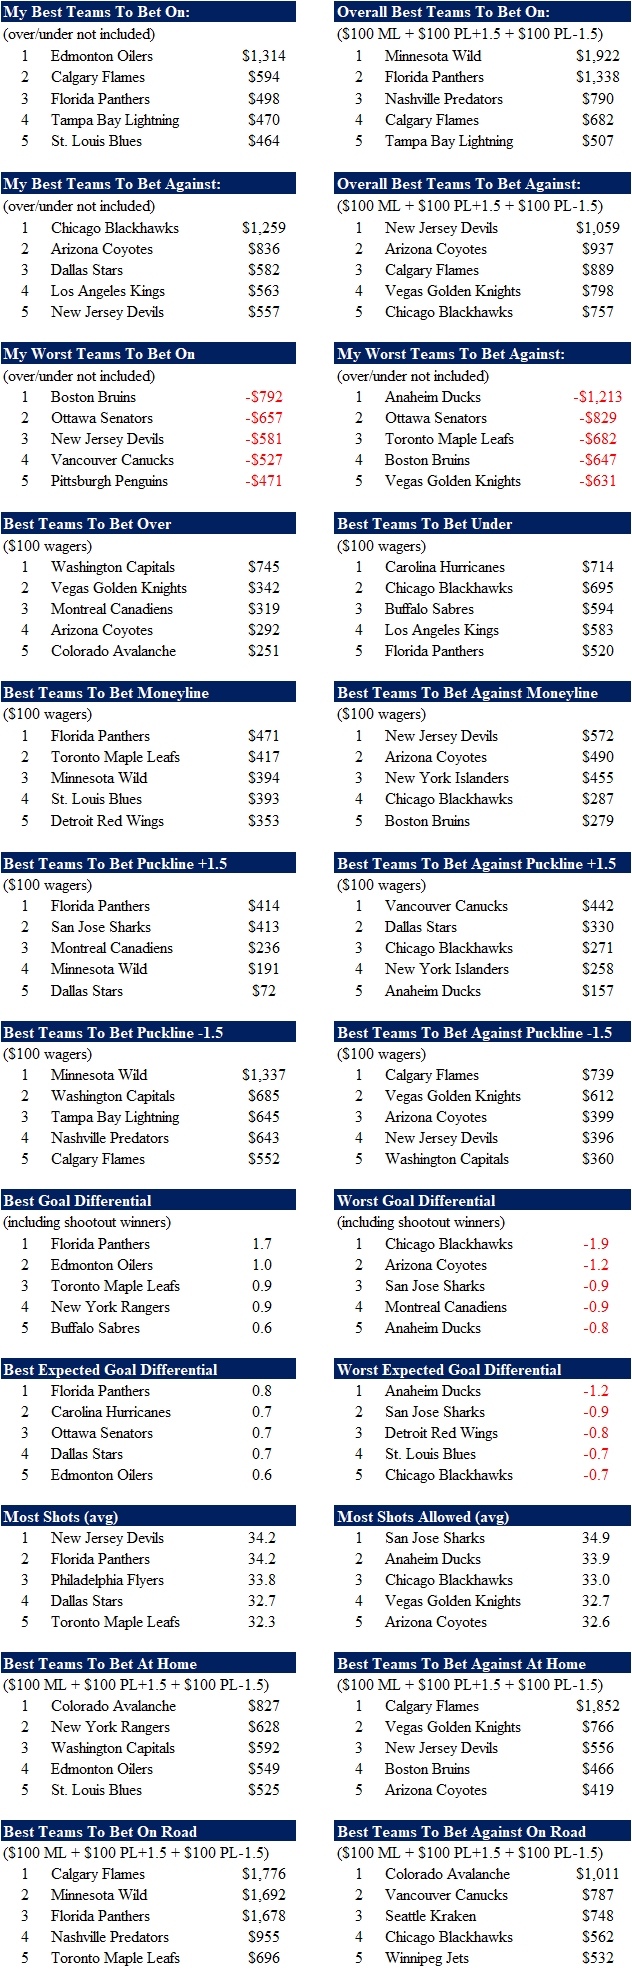
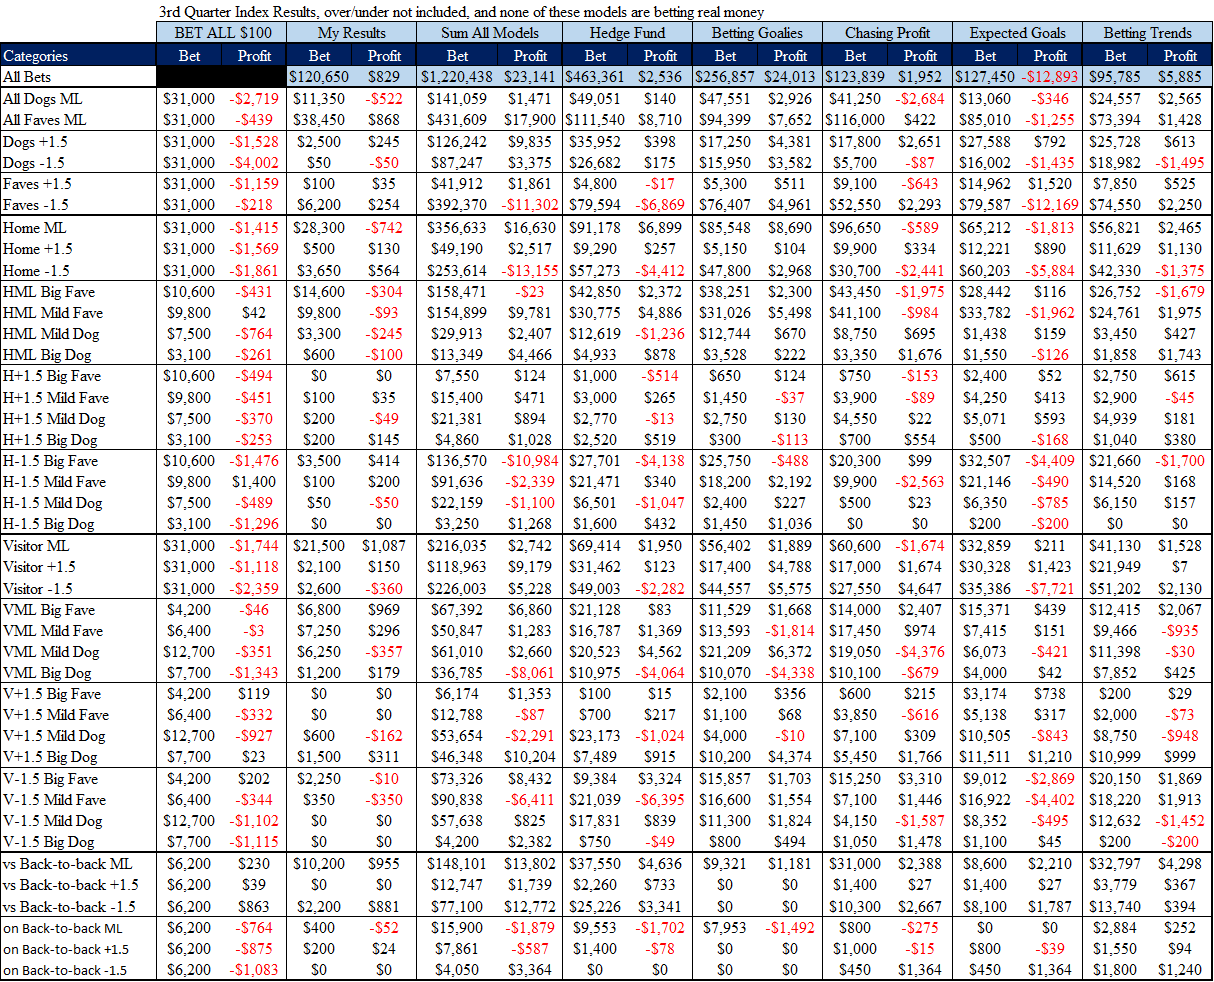
You can see some team-by-team results below, but the individual squads will be discussed in the team sections. There are several additional categories here that you don’t see in my weekly betting reports. Granted, I could provide this whole set every report because the data is there, but the stuff below best over/under is less visually appealing and meaningful with smaller sample sizes. That’s why I only tend to break it out for the quarterlies. None the less, there’s plenty of data for you to chew on.
One fun fact: Calgary cracked both lists for best to bet on or against, thanks to pucklines -1.5 goals (they hit a few as dogs, and lost a few as big favorites). If you bet $100 on both teams to win by -1.5 goals in every Flames game in Q3 (yes, betting both sides of each game) you banked $1,300 (mostly coming from dogs).
Favorites vs Dogs
There is a never-ending war of attrition between favorites and underdogs, and while there was close correlation between the chronological shapes of the 2021/22 and 2022/23 results, this diverged considerably in the current schedule with fewer teams actively tanking in the first half. That diversion became even more pronounced beginning near American Thanksgiving, which was precisely when my Tailing History model version 1 crashed. Favorites -1.5 goals was wildly more divergent than moneyline. There are periods of time when 2023/24 and the last two years go up and down at the same time, where Tails 3.0 has been able to thrive (version 3 bets fewer games -1.5 goals).
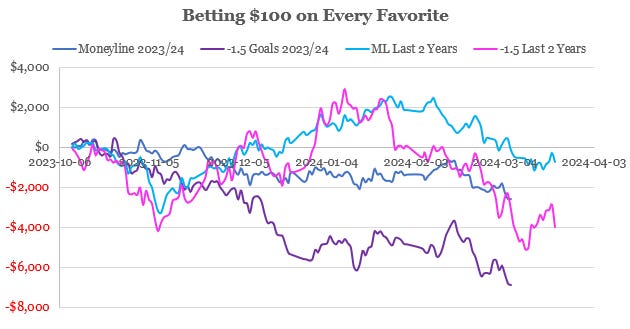
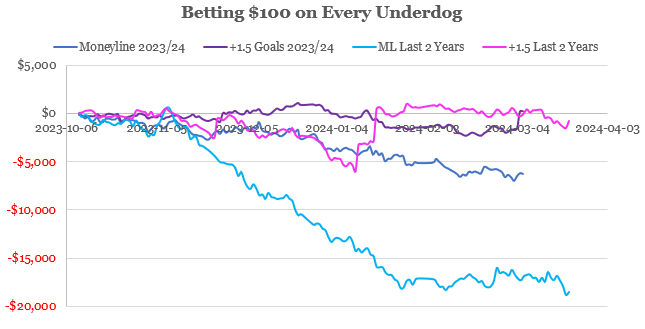
You may be thinking that the dog chart looks like a mistake, and the same thing occurred to me, leading to a 45-minute diagnostic ensuring the accuracy of the nosedive in the previous two seasons. Dogs were indeed terrible in the 2nd quarter of the previous 2 years, then flattened out in Q3 (before dipping back down post-deadline). If you bet $100 on every dog ML Q2 of the previous 2 years, you lost more that $10,000. That’s mostly December. You can see above that there was a lead-indicator that +1.5 started covering more about 2 weeks before the ML nosedive pulled up. Favorites -1.5 goals was an awful bet in Q3 of the previous 2 years, but not quite as bad in 2023/24.
Over/Under
Unders went 156-137-17 in the third quarter, where my own performance betting totals improved substantially almost immediately after the clock struck noon on the season, and it was almost entirely because of unders (totalling $3,120 profit in the quarter). The “TSN Turning Point” was demoting my algorithm formerly known as Prime from a leadership role and shifting to a “Small Council” of advisors. The fallen leader was given a position on the new advisory team, more because of past reputation than current profit, joining with 4 other algorithms who were all competent and worked well when agreeing, all approaching their calculations through different methodology (more on them in the model section).
The x-game average types all vote the same way too often, which can be detrimental in specific weeks. Towards the end of the quarter, 6 over/under models were constructed that sort games into groups, and bets different according to each. I’m still using the Small Council though, because it’s still performing well and the models need to prove themselves with real-world data, not just tailored to history. Oddsmakers evolve too, they get smarter to get an edge on the sharps. Profitable angles are regularly nerfed, but often times closing doors can open up new opportunities on the opposite side.
If you bet $100 on every under when the total opened at 6 in Q2, you lost $1,200. In Q3, you would have won $354. So that flipped.
We had 24 totals open at 7 goals in Q1, that dropped to just 5 in Q3. You can see why, unders went 5-0 in Q3 (26-17-6 on the season).
Overs are 17-13 when the total opens at 5.5.
League save percentage dropped from .900 in Q2 to .898 in Q3.
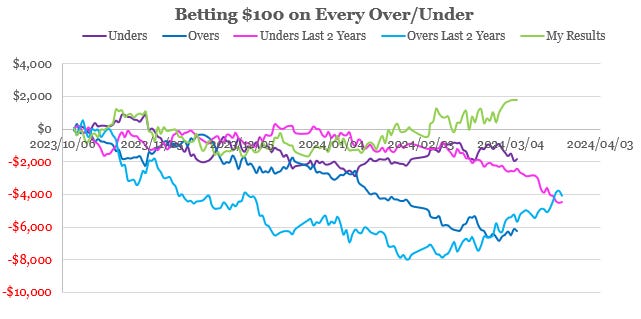
One thing that’s important remember looking at the chart above, it’s a little misleading if you’re trying to extrapolate a specific strategy like “bet over” because the above lines don’t distinguish between 5.5, 6, 6.5, everything is just added together. There have been instances in previous seasons with unexpected scoring spikes where oddsmakers were slow adjusting to the newly emerging trend, but they surely learned a valuable lesson from the Omicron scoring boom in December 2021. There are certainly stark similarities and differences in the shapes of the current season and the last 2 years, which you can see trending back up as Q4 is underway (scoring is currently down big in week 1 of Q4).
Over/under is discussed that the team level, and that’s where individual strategies are best developed, not looking at the league macro. For me the macro is more of a tie-breaker.
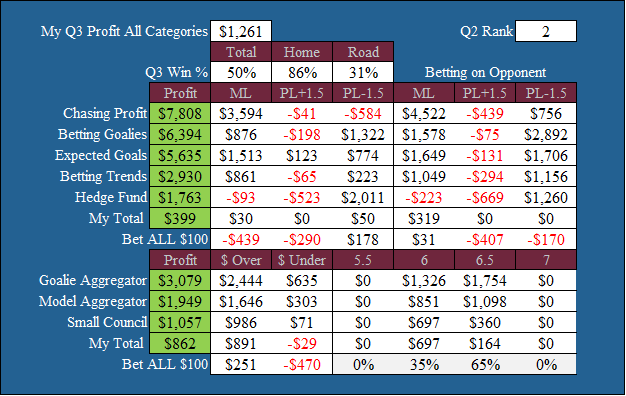
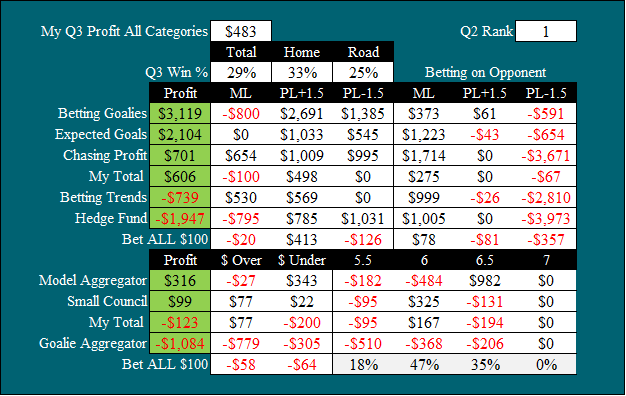
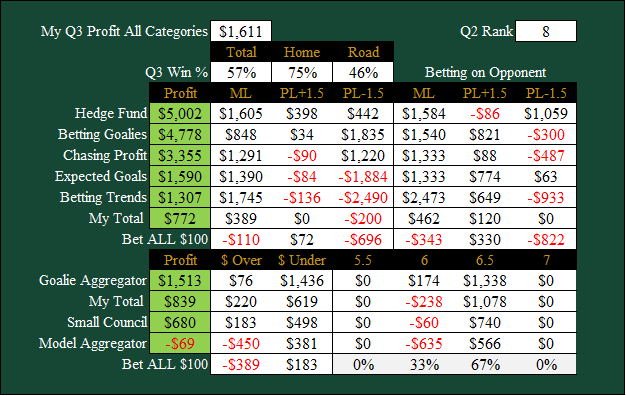
My Models
The end of Q3 marked the halfway mark for my tournament of models. Once the tournament officially began, I promised to stop building new models for the rest of the regular season unless it was playoffs. My first two models Tailing History and Betting Venues received full makeovers after the race was underway, but both were mortally wounded demanding resuscitation. A few other bad performers were euthanized and/or replaced with version fit to larger samples (all but Shorting Travel 2.0 fit to playoffs). My Expected Goals models aren’t performing well, and may need to be refit to “5v5” instead of “all situations” (which I prefer for over/under purposes).
Unfortunately, some of the newest models were fit to data that included Q3, so their Q3 results are invalidated. The tournament will start fresh in the 4th quarter with everyone prognosticating with real-time data. That will separate the men from the boys. I’m developing an addiction to building betting models (but in the fun productive way (I have no kids to neglect)), and I don’t even let these play with real money. There will be a mass diagnostic, refitting process this off-season to make sure everyone worked as intended in 2023/24. Some of these are a little too “niche” or have too many vectors with insufficiently large individual samples that are very vulnerable to variance.
Betting Loss Trends was the apex of compartmentalization, but did so with a 4,500-game sample. It had 60 regular season vectors, and 40 playoffs. On average that’s 75 per section. It only abstained from 54 games, most of them at the beginning of the seasons. But while it produced a 17% profit when fit to the historical sample, turning that into a working automated model was complex. This one was the most complex of any, possibly to a problematic degree. I’ll be the first to admit that my spreadsheet is very ambitious in its scope, hence my frequent references to Icarus flying too close to the sun.
The evolution of my model building/tracking has spawned addition logistical pressure on the day-to-day process. Last year very little changed in my spreadsheet structurally from beginning to end, freeing up brain time to muse about the season and its trends. The biggest problem is the number of ideas I’m conjuring on a daily basis. My thought factory has been churning out new models and spreadsheet improvements at an accelerated rate. Meanwhile, new games continue getting played, so I’m juggling the idea bombardment with new information constantly feeding the beast. Mistakes do happen, but I’m diligent with diagnostics when anything looks wrong.
There is a recently updated post that explains the premise of each individual model (sometimes even sharing the cerebral cortex), sorted by Index. Many of the titles are self-explanatory or at least provide some indication of what’s going on.
Betting Trends: Tailing History 3.0, Betting Venues 2.0, Betting Loss Trends
Chasing Profit: Max Profit, Game Sum 2.0, and my own picks (I have been assimilated into the Matrix…)
Hedge Fund: Shorting Travel, Shorting Value, Weighted Wins
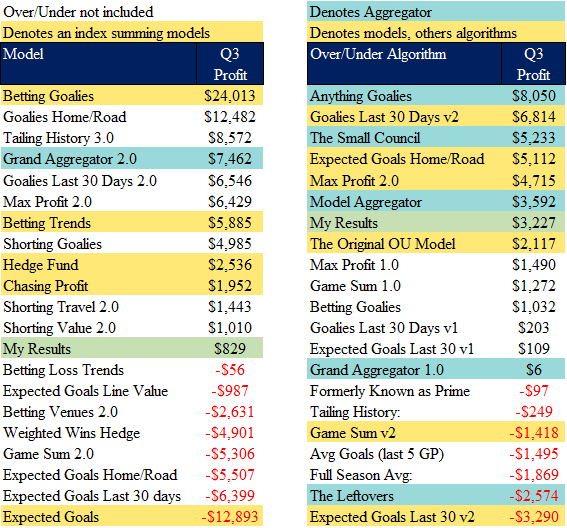
It's very important to note that the model results you see above and below are not genuine because some of the models were fit to samples that included Q3 2024 data. The newer ones (including many with a 2.0 or 3.0) did not accrue all those results making picks for new games. There are a few who were active in their current form for the entire quarter, namely, Weighted Wins, Expected Goals L30 and Line Value, and Shorting Goalies. Retroactive changes to my own picks are strictly prohibited. Also, none of the over/under models registered real-time picks until late in the quarter. Everyone will be working in real-time for the full duration of Q4. Even the Shorting Travel 2.0 retrofit wrapped in time.
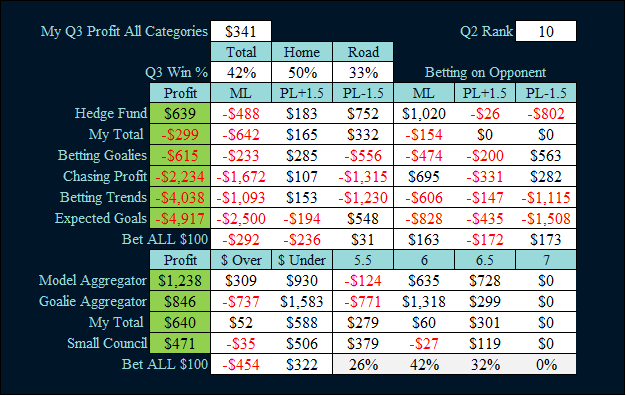
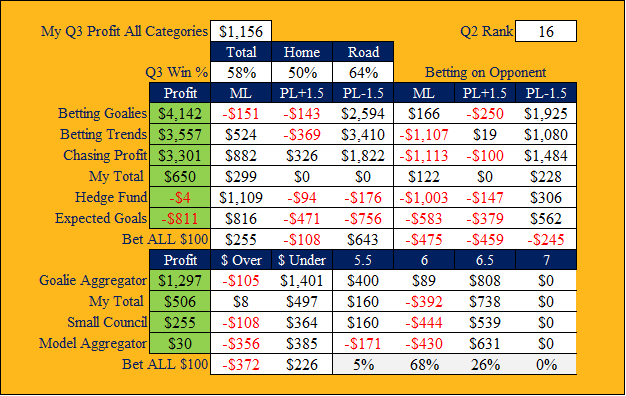
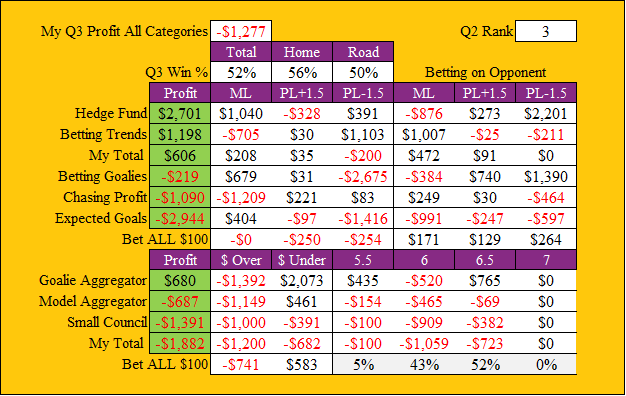
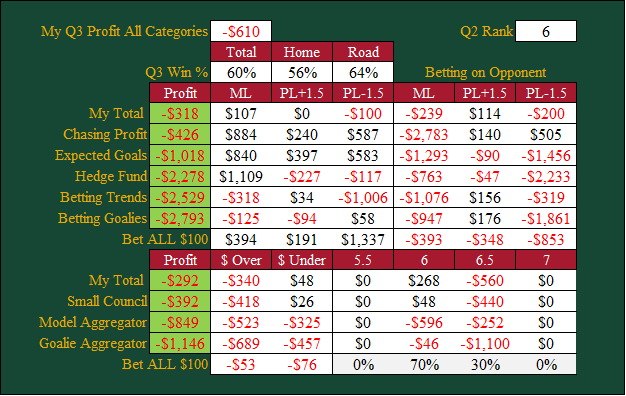
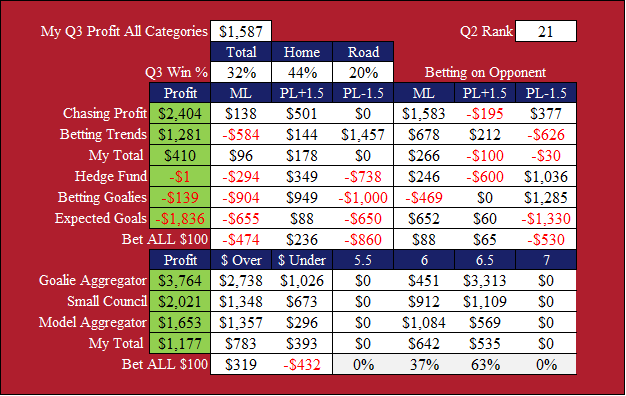
All members of the Small Council (Max 1.0, GS 1.0, GL30 1.0, xGs 1.0, Formerly Prime) were active in their current forms for the entire 3rd quarter. Some aggregators (and each index) are just a sum of the member models, but some are an actual formula that makes a pick based on the ratio of the members. The Small Council Aggregator you see is an actual formula that’s used for my picks too, it’s not just adding the member picks together (which would still be highly correlated and similar). The table below shows each index results for the quarter by category, and while some had an unfair advantage fit to games that already happened, they still made mistakes that reveal potential weaknesses.
Goalies
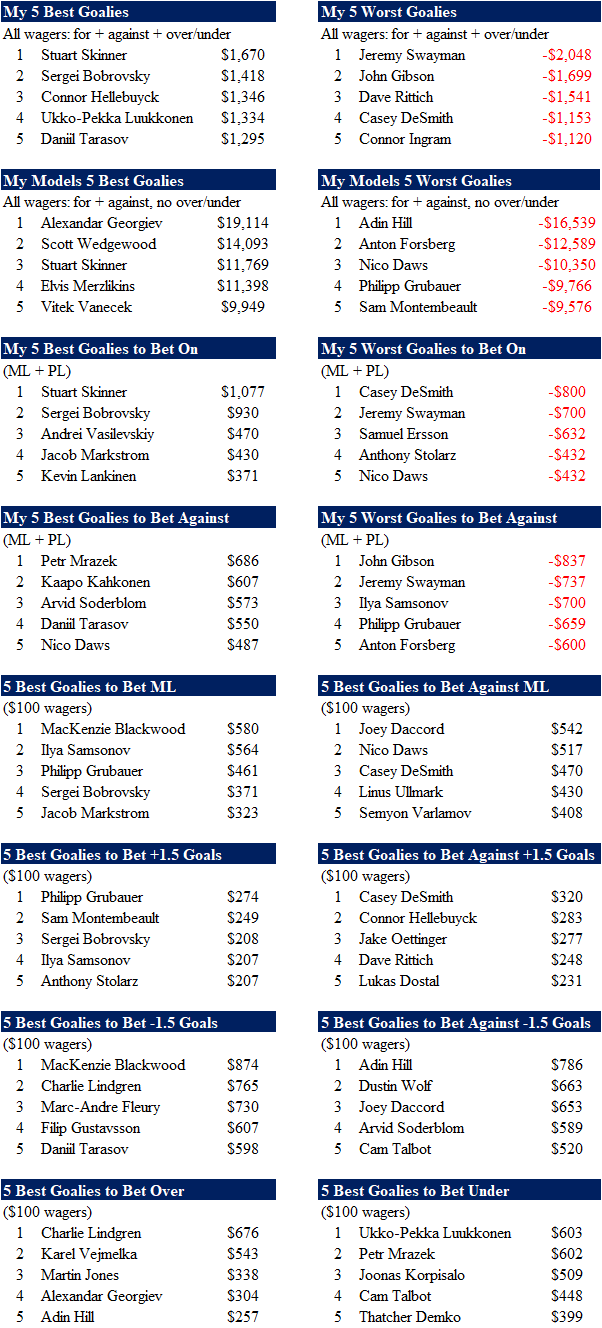
One of the cornerstones of my game-by-game betting strategy has been paying close attention to which goalies are hot or cold at any given moment, who is likely to start, and making bets accordingly. In my “game notes” quantification project last summer looking for patterns in my explanation for why each bet was made, #1 on the list was anything mentioning goalies, with a 20% rate of return across 2 full seasons of recording these notes. As a former goalie myself, I take pride in my ability to gage which direction the wind is blowing. Many in the analytics community refer to goalie forecasting as “voodoo” and the wind often abruptly shifts directions, carrying you away if lacking situational awareness.
My final model retrofit project set up the scaffolding to renovate/create several different over/under/ML/PL models based on a wide variety of factors. This included a few different goalie-based models, which required me to make a projected starter probability for all historical games, using the two goalies who started most often in a team’s last 10 games (ties go to the most recent). It did not directly account for injuries, but did catch on quick when a high-volume G1 goes multiple games without starting. Each consecutive game they don’t start, the probability of starting the next game drops considerably. Then within maybe 3-4 missed games, they are no longer regarded as the G1 because that fluctuates based on usage.
This process involved me investigating every permutation, including goals against in the previous game, and how many consecutive games the G1 had played or missed. If a G1 has started 3-consecutive then gives up 5 or more goals in a loss, they’re less likely to start the next than if they win the game. What’s interesting (now that I think of it) is that this estimated probability was calculated for most of the current season as well, and my projections have been going for about 3 months. Note to self: see if my brain’s arbitrary projection is better or worse than the formulaic approach.
Goalies are so critically important to who wins or loses the game, that it’s important to have your finger on the pulse to the best of your ability. In past seasons, many of my best runs were sniffing out terrible goalies, trying to figure out their likely starts, and exploiting the opportunity. Jimmy Howard and Carter Hutton are the two best examples. Problem is, those magnificent turds have considerable difficulty sustaining NHL employment. The full breakdown of which goalies were the best to bet on or against is provided below. This includes which goalies were the best and worst for my models and me.
Goalies will also be discussed in the team sections below.
Team-by-Team Profitability Rankings
The San Jose Sharks held top spot in my profitability rankings for most of the first half (minus a week or two) but were overtaken by the Colorado Avalanche very early in Q3, who charged out to a big lead (before slipping back down after a bad road trip). The Oilers were arguably the league’s best team for a minute (before being overtaken by Florida), but their first half struggles cost me a considerable sum and it was a deep hole out of which to climb. It’s hard digging out of a hole like that when oddsmakers are charging exorbitant prices for their lines, but their unders actually helped pull me back towards even (until those crashed too).
The Profit results (and thus the order of the team reports) is full season profit, not just Q3. The Q3 and Q2 rank denotes their full season rank the day each quarter ended.
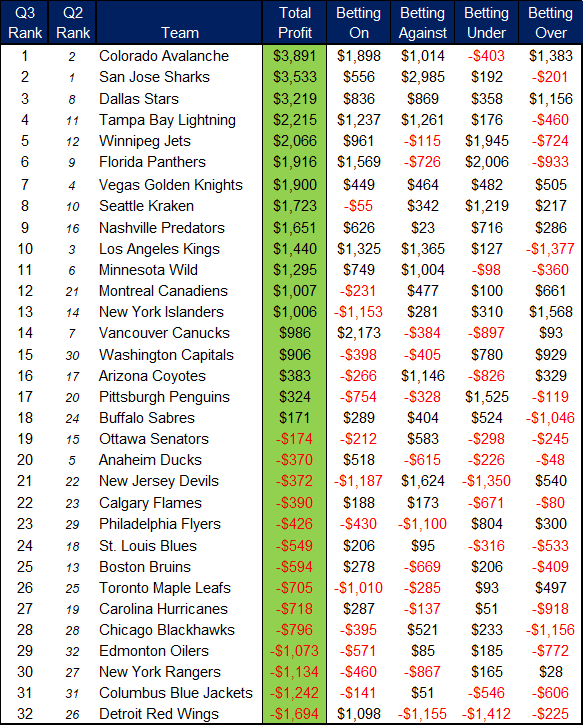
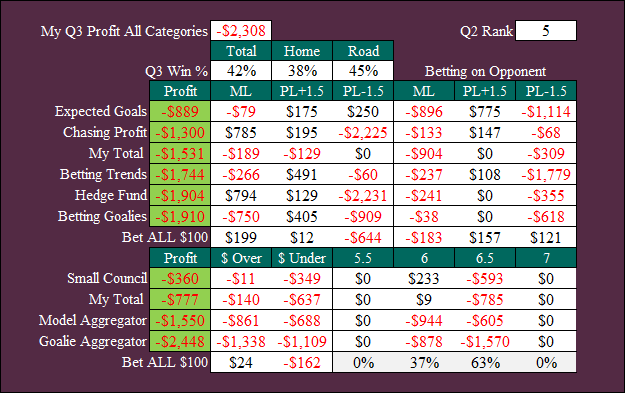
1) Colorado Avalanche, ($3,891):
The Avalanche rumbled out to a big lead in my rankings shortly after Q3 began, during a profitable run with Nathan MacKinnon in beast-mode. They lost Val Nichuskin, but Arty Lehkonen returned and Alexandar Georgiev stabalized (my results looked very similar for both goalies). Their overs were on a hot streak of their own as January rolled into Feburary. Colorado spent the first 3 quarters of this season as a historically awesome home team, which probably has something to do with chasing Makar and MacKinnon around the ice at high altitude. On the road was a different story, and my confidence in their prowess did more harm than good away from Denver
All my betting models handled this team better than me, every index pulling profit both betting them to win and lose. Given that they won 80% of their home games and 30% of their road games, you can guess how the models managed such and impressive feat. But I’m also privileged to see my model picks before deciding my own choices, so the blueprint for that successful strategy was right in front of me and disregarded. This was the #1 team for my expected goals models, by a $2,000 margin of victory. Granted, that was not the case in Q2, so it’s difficult to predict if that particular angle will remain fruitful.
2) San Jose Sharks, ($3,533):
The Sharks sustained first place in my profit ranks for most of Q2 despite posting a small loss in the quarter, thanks to my outstanding success betting them to lose in Q1. Just as it was starting to look like they were once again trending towards that rocky bottom, Logan Couture returned to the line-up lighting a spark that even set Marc-Edouard Vlasic ablaze. That caught me off-guard, but eventually took notice. Then not long after Couture returned, they lost Tomas Hertl to injury and with that loss, the mini-heater ended. If your hot streak is dependent on timely goals from anyone named Vlasic, it’s probably not sustainable.
If you bet $100 on Sharks to win every game in Q3, you would have turned a small profit. It helped my own results refraining from betting their opponents -1.5 goals (totalling exactly $0 in Q3 when that was among by biggest Q1 wagers). My models collectively handled this team well, especially betting them +1.5 goals (which I tailed along a few times), but by the same token were also too eager to bet their opponents -1.5 goals, which was a bad bet overall. This was not a good team for my over/under goalie aggregator, though it was not difficult projecting who would be starting, the data just wasn’t profitable.
3) Dallas Stars, ($3,219):
The Dallas Stars overcame some injury issues in the second quarter, and resumed being one of the best teams in the league once healthy. I did an effective job navigating both sides (taking a short position without Oettinger and Heiskanen), but was mostly betting them to win once Q3 was underway. They won 7 of 8 games from Jan 23 to Feb 15, then lost 5 of 6 from Feb 17 to Feb 27. There I was, comfortably crusing along on the Stars bandwagon when the driver lost control and spun into oncoming traffic. Inconsistent goaltending really helped their overs for the first half, but both settled down in the back half of Q3.
My models were excellent with this team in Q2, and even better in Q3, as this was among the best teams for both my Hedge Fund and Betting Goalies portfolios. Even the expected goals models who struggled this quarter did well picking these outcomes (but once again losing -1.5 goals). Dallas won 57% in Q2 and 57% in Q3. Oettinger was not in Vezina-form, but still provided comfortably above-average goaltending while Wedgewood only won 1 of 5 starts. So long as my models continue handling this team proficiently, my own success will surely follow in its wake. Over under did account for a majority of my profit with this team, but much of that was tailing the Small Council.
4) Tampa Bay Lightning, ($2,215):
I’ve repeated this dozens of times in reports, previews, and Tweets, the playbook for Tampa has long been betting them to win at home, lose on the road, which continued to be true in the early part of the current season, until a shift in Q3. They were actually a better road team, winning 60% (versus 56% at home). Coach Cooper continued riding goaltender Andrei Vasilevskiy harder than a cute intern at the White House and received below average puck-stopping from that workload (team SV% was .882 in his starts, while expected SV% was .900). Vasy started 16 games, Johansson 3. Makes sense to maybe mix in the back-up more often if your surgically repaired star is buckling under the workload.
The roster was missing Mikhail Sergachev for most of the quarter, but that did not seem to slow them down, at least initially. They were without him for most of it and had their best quarter for winning percentage, as they clung to a wildcard spot. Below average goaltending and beast-mode Kucherov is enough to keep a team in the playoff race. Kuch was already at 105 PTS with 20 games remaining, and if they tried stashing him on LTIR for the 4th quarter, they would probably miss the playoffs. What helped me with this team was strong advice from my models, who handled them proficiently, the goalie models especially, both wins/losses and over/under. Not sure they needed me to type in starter probability. My probability was typically 90:10, but Tampa’s stats very closely mimic Vasy without needing to distinguish.
5) Winnipeg Jets, ($2,066):
My joyful ride aboard the Jets first class bandwagon paid dividends in the second quarter, but we all got bumped back to economy early in Q3. They missed Mark Scheifele for a stretch, Gabe Vilardi battled injury issues, and the hot streak cooled. I was hoping the metaphorical luxury airliner would get back up to crusing altitude, losing a few big bets in the process. The good news is that their unders managed to cover for the deficiencies elsewhere. Then they made a trade for Sean Monahan, which at least helped spark a fire on their power play, and once that got going, the team resumed rolling. They followed up a 5-game losing streak by winning 8 of 10.
That little heater almost brought me back to zero picking their wins and losses, but alas it was unders that were responsible for more than 100% of my profit. It certainly helps having arguably the league’s best goalie tandem (Hellebuyck was slightly worse than the previous quarter, but still elite). It’s interesting that my goalie models performed very well betting Jets opponents +1.5 and -1.5 goals. Both that was driven by Hellebuyck, as most of his losses were by at least 2 goals, while similarly bad at covering -1.5 goals in his wins. I bet $0 on either team -1.5 goals in 18 Q3 Jets games. If you’re going to bet the Jets, stick to the moneyline.
6) Florida Panthers, ($1,916):
My ticket aboard the Florida Panthers wagon was a big winner in the second quarter, but the road conditions iced up early in Q3, with a 4-game losing streak that was followed by winning 12 of their next 14. One fire that burned fanatically was the one in Matthew Tkachuk’s motor, as his slow start to the season became a distant memory. But perhaps the biggest driver to their success was Sergei Bobrovsky, who started making a Vezina case with arguably his best quarter as a Panther (he did have a .940 SV% in Q1 of 2021/22). Dynamic scoring and elite goaltending is an effective combo to win hockey games, but that didn’t exactly help me on their pucklines.
Their scorching hot unders continued, albeit at a slightly cooler rate. Most of my advisors generated good profit from those unders, but most also sunk a little too much into their overs. Their unders went 12-6-2, and if you bet $100 on each under, you banked $520 (half as much as the previous quarter). The Hedge Fund did well betting Panthers games in the previous quarter, but that completely flipped in Q3. If you’re wondering how my models lost so much money betting Florida opponents -1.5 goals, the losses you see is their total amount wagered, which is actually a small share of everything combined, they just hit zero of those. A few were against Colorado, a few were on their 2 back-to-backs, and Panthers were 3-0 in those games.
7) Vegas Golden Knights, ($1,900):
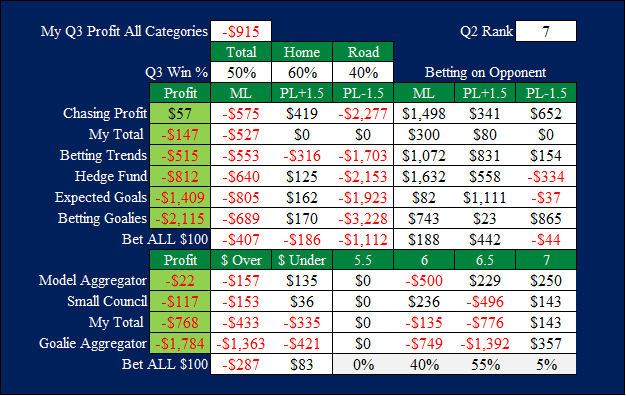
The Vegas Golden Knights entered the 3rd quarter severely wounded with several crucial players on injured reserve, which had me enthusiastically betting their opponents. That worked initially, but they started winning games again before they were even fully healthy and then some of those pieces began returning (most importantly Adin Hill). Once Adin Hill and William Karlsson were back and Nicolas Roy was elevated to top line center, this team got hot. It took losing a few bets before I jumped on the bandwagon, but Hill is on one of my fantasy teams, so I’m pretty aware of his status at any given moment.
Then as Jack Eichel was nearing return, Mark Stone went on LTIR, probably until playoffs to save cap space. It’s really hard for me picking Vegas without Stone, but yet they managed to beat the red-hot Maple Leafs 6-2 without either (which was upsetting because I confidently shared my short position for that game on this blog, thankfully I hit most of my other picks that night). Vegas struggled as the quarter closed, their status was middling at best, fortunate they banked all those wins in the first quarter, otherwise they’d be in danger of missing the playoffs after winning the Cup. At least they did get Shea Theodore back, which was a big boost for their blueline, then added some big pieces at the deadline.
8) Seattle Kraken, ($1,723):
The Seattle Kraken struggled out of the gate, then eventually caught fire on the back of Joey Daccord (so much so that my Q2 report included a joke about Joey selling his soul to Satan, but it needs to be noted, I listened his interview on Chiclets and he seems like a really nice guy). If Daccord used a magical monkey paw to find his apex, then one of the unintended Q3 consequences was the goal support drying up, at least early in the quarter. Eventually Philipp Grubauer did return from injury and was fantastic, pushing Daccord back into the back-up role, so if any supernatural forces were at play, Joey came out the loser (his million-dollar contract notwithstanding).
This is a curious team because my results were better than most of my models, who largely struggled (over/under notwithstanding) mostly from betting them to win (their winning percentage dropped from 55% in Q2 to 42% Q3) but the team did heat up once Grubauer did so himself. My confidence in this team was never very high, and it generally took getting a little juice on them as a dog before they started looking a little more enticing. This was the #1 worst team for my collection of expected goals models and #2 worst for Betting Trends, so take that for whatever it’s worth. Their unders went 11-7-1, and this was a good team for a variety of different models/methods.
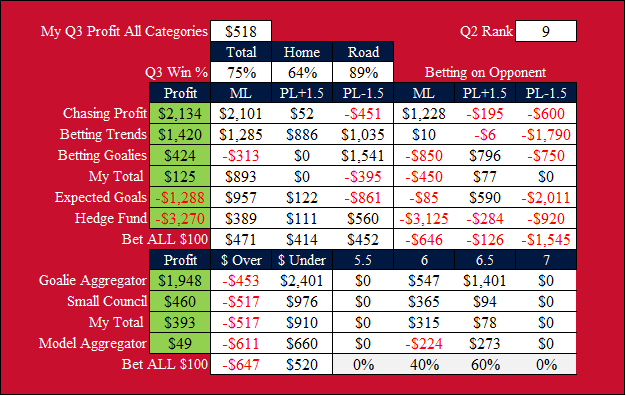
9) Nashville Predators, ($1,651):
The Nashville Predators won 60% of their Q2 games, including a whopping 80% on the road (yes that means they were under 50% at home), but they came crashing down from that peak, in part because of the declining play of Juuse Saros. The Preds went 2-7 from Jan 20 to Feb 15, then peeled off 8 straight wins as Juuse Saros reversed his slide. That’s been their season, when he’s good, they’re good, and visa versa. They had to hand Juuse a heavy workload because Lankinen was much worse and not earning starts for a team that was sitting in a playoff spot when many thought they’d be rebuilding.
They were reportedly listening to offers for Saros, but the wicked heater as trade deadline approach surely quashed any ideas Trotz may have had about selling. Granted, former first round pick Yaroslav Askarov is dominating the AHL, so they could actually get better trading Saros. They had the same start distribution as Tampa 16:3, so the success of my goalie models betting this team was likely not the result of my astute starter predictions, but rather Nashville’s numbers on the whole (Lankinen had a small footprint). Both my Betting Trends and Chasing Profit groups did very well betting Predators to win and lose by at least 2 goals.
10) Los Angeles Kings, ($1,440):
There was a point in late November where I posted a Tweet about the tremendous value on the LA Kings Stanley Cup odds when they were arguably the best team in the league. I would go back and delete the Tweet in a vain attempt to erase that memory, but that doesn’t help anybody holding a Kings Cup ticket on that advice. The talent is on the roster, just not in goal, and that’s the part that should have been obvious. There’s no way Cam Talbot was going to sustain Vezina-level play for a full season. The team had lost 14 of 18 games entering the all-star break and fired their coach. They received a new coach bump, but Dmitri Filipovic floated the idea that they were due for positive regression regardless.
This was an awful quarter for my Kings betting, and 147% of it came from over/under. It was a minefield, with one 12-game stretch going 1-11, to the point where it would have been advisable to stop sharing OU picks for their games. This team was a net loser for most of my models, but the Hedge Fund did well during their losing streak(s). The problem is, I’m often advertising providing picks for every single game in a night, which requires sharing picks I’ve been struggling with, but generally I’m good with providing disclaimers. The goaltending did improve late in the quarter, as Cam Talbot was seemingly cured of his cognitive ailments with the coaching change.
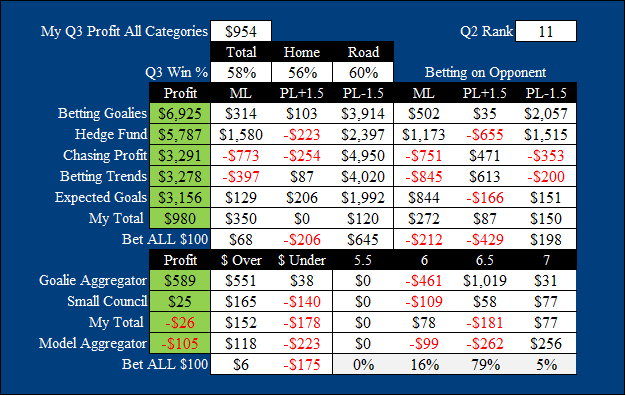
11) Minnesota Wild, ($1,295):
This has been the season from Hell for Minnesota (in an alternate universe where Hell is frozen), between devastating (and frankly ridiculous) cap recapture penalties and injuries to key defensemen, they’ve been behind the 8-ball since the beginning. They did fire their coach and briefly received a “new coach bump”, but that eventually dissipated. They were all but out of the playoff race by halftime, but still had good (but inconsistent) goaltending and a potent top scoring line. Once that scoring line got rolling, the fire returned and they started winning more often, sadly for Wild fans, LA and Nashville also sparked heaters around the same time, preventing Minnesota from gaining on the wildcard.
My models absolutely crushed Minnesota in Q2, then fell off a cliff in Q3 (aside from the Chasing Profit fund, who performed very well betting them to win by at least 2 goals). Those pucklines -1.5 goals were the best Wild bet, but one that I rarely made. Of their 12 Q3 wins, 9 of them were by at least 2 goals. In 20 games their overs went 10-10, and I emerged from that with $8 profit. For the most part the goalies played well (with a few exceptions) but the offense caught fire. Optimal scenarios are great offense, bad goalies. Their lines are sometimes priced like they’re still the same team from last year, at least when facing a lesser opponent.
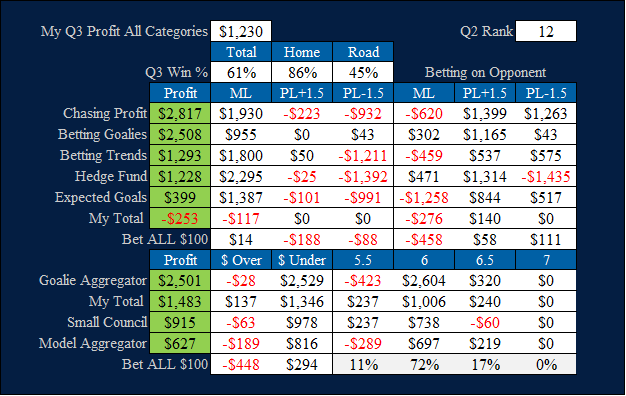
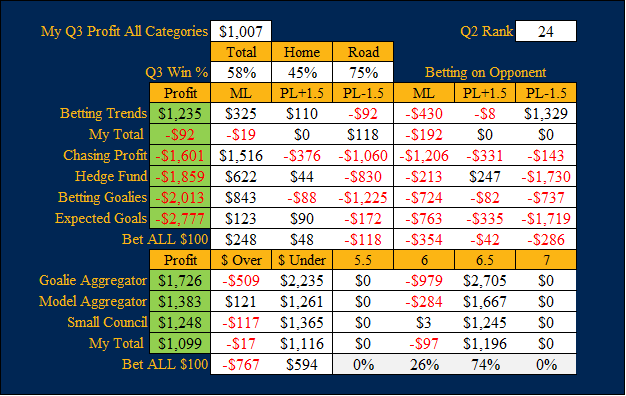
12) Montreal Canadiens, ($1,007):
Montreal was dead last in my profit ranks on American Thanksgiving, but the enigma clouding my foresight corrected afterwards, aside from a few hiccups here and there. My models collectively followed a similar progression, though more than half of them recorded no wagers on the first quarter, and the advisory team was much different back then. Still, the models did lead me astray early in the season, but also helped me pull out of the funk later. Exercise caution whether betting to win or lose, because their proclivity to upset good teams and lose to bad ones injects concerning volatility. I’m often left feeling stupid whether betting them to win or lose.
What really drove my Habs success in Q3 was over/under, with the goalie aggregator picking the winner in a big majority of their games. You might think that would be difficult with their 3-headed monster in goal (Montembeault started 9, Allen 6, Primeau 4), but the team was really good at naming the starter a day ahead, so I probably predicted with 100% accuracy in 65% of their games. Not that it mattered, since none of the goalies were good, though they did have an .890 expected save percentage as a team, so that was most certainly not a goalie friendly environment. They do have a few upset wins when I endorsed their opponents, so uneasy feelings are stirring during this writing process. My models did very well betting them to cover +1.5 goals.
13) New York Islanders, ($1,006):
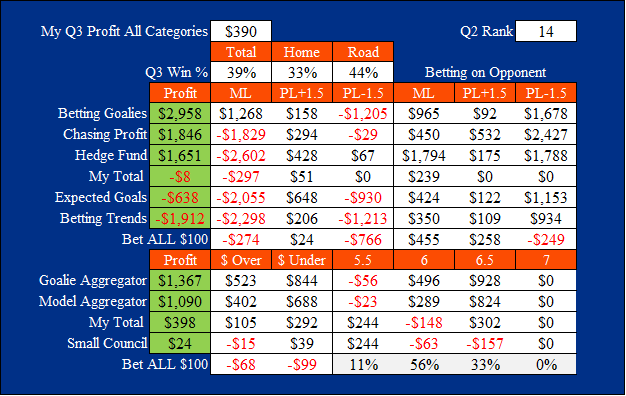
The New York Islanders made a big splash in the hockey world when they fired their head coach (after a short tenure) and hired NHL legend Patrick Roy to run their bench (I’m sure Lou made it clear who is in charge of the roster). My excitement for the potential opportunity to exploit the beloved “new coach bump” did not lead to the anticipated profit; rather it was more of a speed bump that forced the bus to slow down, then traffic was too dense to reach cruising speed. They did have a few big wins here and there that briefly sucked me back in at the possibility of a delayed bump, because frankly, “new coach bumps” come in all shapes and sizes.
One thing that did settle down upon Roy’s arrival was Ilya Sorokin’s performance, which did keep them within reach of the wildcard despite only winning 39% of their Q3 games. They were heating up as the quarter ended, so maybe that “new coach” bump had a delayed response after all? Ultimately my goalie-based models and algorithms had the best success with this team, so it would be prudent to mind their advice going forward (especially on over/under). Their over-under was 9-9. Betting Goalies was the only index that generated profit betting Isles to win, despite a big loss -1.5 goals. Everyone did well betting them to lose.
14) Vancouver Canucks, ($986):
Boarding the Vancouver Canucks bandwagon was one of the smartest decisions in my first half, and watching nearly every single game really helped me feel their vibe. They were first place in the NHL when they acquired Elias Lindholm, a valuable piece that bolstered an already high-functioning roster. They finally began facing some adversity mid-February with their first 3-game losing streak of the schedule. One of the issues was Thatcher Demko falling off his Vezina-level pace to slightly above average, while DeSmith completely cratered, to the point where it became important to figure out when he was most likely to start.
I’m sad to report losing money betting Vancouver this quarter, which is inexcusable given the frequency of my viewing. They spent part of the quarter atop the NHL standings, and were often priced as big favorites. That’s partially why a majority of my betting models sunk far too much money into their pucklines -1.5 goals, which worked in the 2nd quarter. Those pucklines completely dried up, but some were able to offset those losses by crushing their opponent moneylines. It did hurt my own performance getting bad advice from my models, but most of my losses came from over/under.
Out of curiosity, I tried copying my game notes from Vancouver games into Chat GPT asking, “these are my notes from Canucks bets that won, these from bets that lost, what are my strengths and weaknesses?” It had my strengths as 1) use of betting models, 2) recognizing team dynamics; with my weaknesses as 1) over-reliance on models, 2) emotional bias. That’s interesting. To its credit, the words “I can’t not take Vancouver” appear too many times on both lists, and trying to quantify that surely posed a challenge. Chat GPT mostly sucks now and may never have been good.
15) Washington Capitals, ($906):
My second quarter picking Washington outcomes was terrible, whether betting them to win or lose. It was butterfly effect territory, where they would get blown out by Montreal then shutout the Bruins. What really helped them climb out of my basement was over/under, which my advisory team handled excellently. The goaltending declined and the scoring got hot, which is a perfect storm for overs. Granted, erratic goaltending that can shutout top teams and blown out by bottom feeders is dangerous, but my models navigated the squall with remarkable proficiency. It’s hard to struggle when your advisory team is doing an excellent job providing advice.
Their overs went 13-5-1, so it wasn’t hard for just about any model or algorithm to churn a profit from that (except my old defunct betting venues algorithm, which still makes picks that nobody sees or cares about). Lindgren started 13, Kuemper 6, but Kuemper was the better goalie for most of the quarter. The coach seemed convinced Lindgren gave them the best chance, but that didn’t match the results on the ice (Lindgren overs were 10-3, Kuemper 3-2-1). They did unload Anthony Mantha and Kuznetsov at the deadline, but that doesn’t necessarily make them worse. They’ll remain in that simultaneously dangerous yet vulnerable zone before golf season starts in April.
16) Arizona Coyotes, ($383):
The strong first half for the Arizona Coyotes slowed to a crawl early in Q3, when they were playing a road heavy schedule and were losing most of those games. Connor Ingram went from Vezina candidate to a negative for my fantasy team (yes, if you’re wondering, both Saros and Ingram immediately began struggling as soon as I acquired them in trades), but they seemed intent on rolling him out more than Vejmelka even when Karel was playing better. They lost 14-straight games as Feb was ending, which is far removed from the positive vibes radiating from Mullett Arena in Q1. The words “bet the Mullett” appeared with dwindling frequency in my game notes.
There are a few interesting notes: starting with my Expected Goals index losing $3K on Yotes opponents -1.5 goals, which was actually a winning bet in Q3. Most of that came in their first 3 home games in Q3 against Nashville, Pittsburgh, Vegas, which were the only 3 home games they covered +1.5. A little bad luck there. The Hedge Fund was demolished betting Arizona to win, and that much was only wagered because they identified Arizona’s probability of victory was often much lower than the implied probability of their betting line (what I’ve labeled as “negative value”). In this case the oddsmakers didn’t discount their lines nearly enough, and the Hedge Fund took that as evidence oddsmakers knew something they didn’t (in reality they were just wrong).
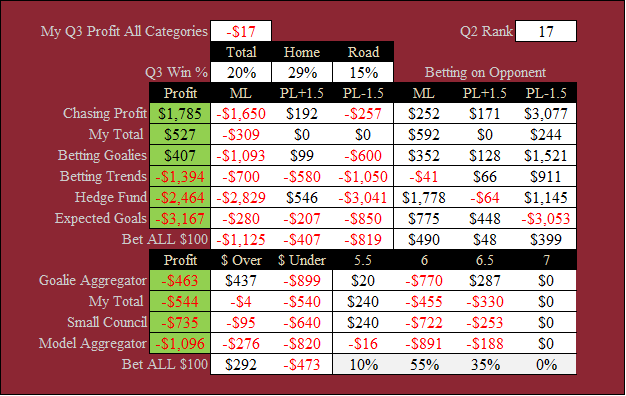
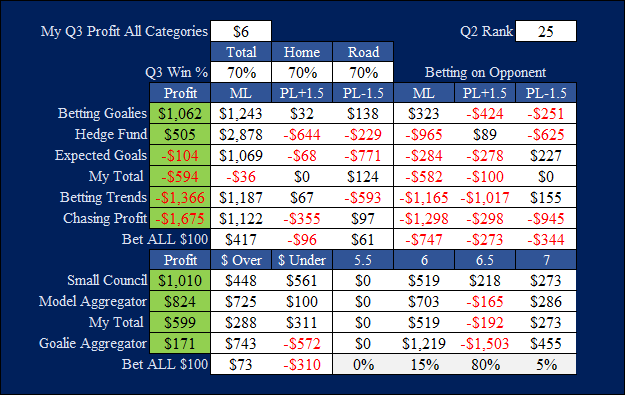
17) Pittsburgh Penguins, ($324):
The Pittsburgh Penguins added a 100-point defenseman in the offseason and Sidney Crosby is playing hockey in a time machine, but that hasn’t been enough to elevate this team into a playoff spot. They spent most of the 3rd quarter outside the playoff race chasing everyone ahead of them, and by the end were sellers at the deadline. They at least were an excellent 5v5 team with a brutal power play (which doesn’t make any sense given the personnel), so many playoff models had them as a high probability to qualify for post-season even when they were trailing by healthy margin. Losing Jake Guentzel to injury was a devastating blow, so Dubas has a solid excuse at his exit meeting in April.
The team had a .900 SV% in Tristan Jarry starts, which was better than the .894 expected, winning 6 of 13. Maybe they didn’t get the key saves in crucial moments, but Jarry wasn’t the problem, at least until the end of the quarter (Nedeljkovic won 1 of 5 starts with a much lower SV%). My Betting Goalies index struggled with Pittsburgh, with much of the damage done -1.5 goals. Whether betting them to win or lose, +1.5 was a better bet than -1.5. What drove my quality quarter was over/under, with unders going 11-7 and better with Jarry in goal. My feeling is that the roster has too much pride to give up on the season and will keep fighting until the bitter end (technically I’d rather they check out early).
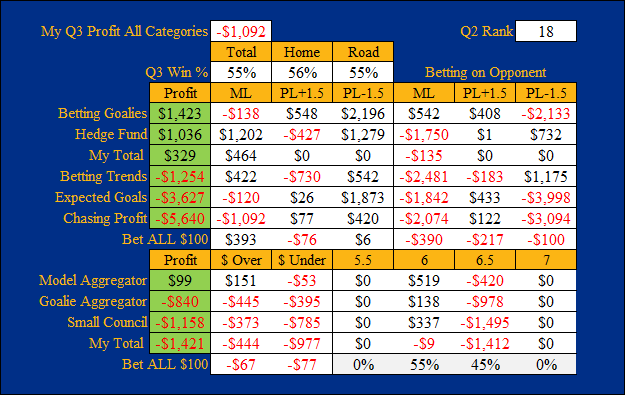
18) Buffalo Sabres, ($171):
My betting models collectively excelled betting Buffalo games in the first 2 quarters and my biggest issue was not listening to their advice nearly often enough. Part of the problem was that they were hitting pucklines -1.5 goals often as underdogs, but were also regularly losing by -1.5 goals when favored. Turns out some of my models were hitting those, whether they were sniffing out the true value or blind luck, I often lacked the bravery to tail some of those picks. Early in Q3, that trend continued, but those pucklines stopped cashing towards the end of the quarter, with my models collectively losing money on that wager. Same with betting their opponents -1.5, which they hit a lot first half too.
The team did start winning far more often once Ukko-Pekka Luukkonen began providing solid goaltending. Even as they were far back of the wildcard, they continued implementing a very heavy workload, probably because that’s exactly what he wants after years of platoons, pandemics, and never getting a full load (it was mentioned in last spring’s Hockey News Future Watch). My goalie models struggled with their wins and losses, but not over under. Their unders went 13-6, so most methods should have been able to generate profit with Buffalo specifically. My biggest problem with the UPL workload was predicting Comrie would be next up too often (thus scaring me away more than necessary).
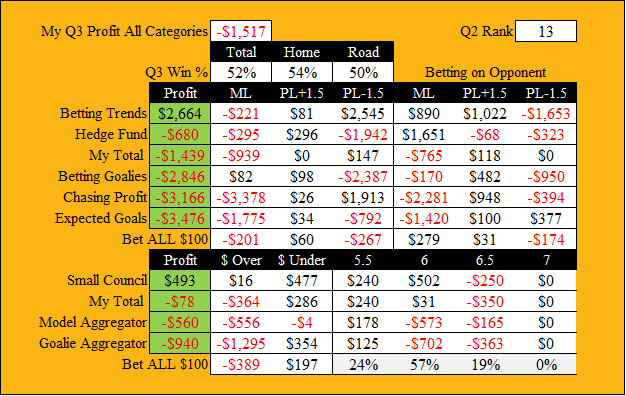
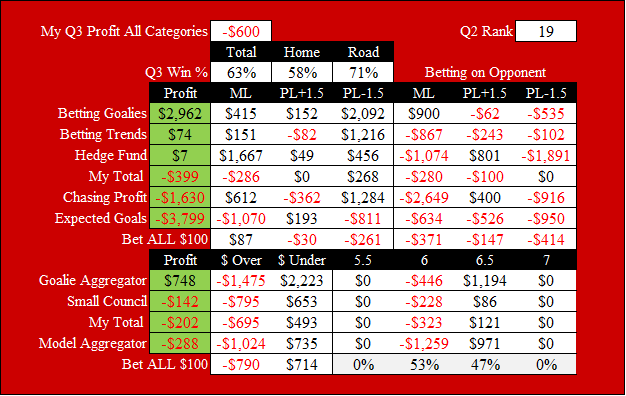
19) Ottawa Senators, (-$174):
My biggest issue with the Ottawa Senators in Q2 wasn’t picking their wins and losses, it was their over/unders (posting a big loss on both sides). That problem corrected itself naturally as the goaltending stabilized with Korpisalo going from awful to average then back again. Forsberg returned from injury and was good initially before struggling himself. Their ratio of overs to unders barely changed (at least early in the quarter) yet my output picking them completely reversed course. Obviously, improvement in net (GAA went from 3.9 to 3.5) helped the team win a higher proportion of their games, as I’m sure a section of their fan base would rather accumulate more ping pong balls in the draft lottery. Granted, the quality of that goaltending varied wildly, it was just better relative to their previous level of awfulness.
This was definitely a team that gave me uneasy feelings whether betting them to win or lose, with a special talent for making me look stupid both when picking either side. There was a volatility that negatively impacted my models, who lost a considerable sum of money betting their opponents -1.5 despite that being a profitable bet overall. It was profitable betting them to lose, but good luck figuring out which games those were going to be with any reliability. For me there was a big loss on both sides, betting them to win or lose, showing my complete inability to get an accurate read on this roster. Too bad, Sens are among my favorite teams despite being in Detroit’s division.
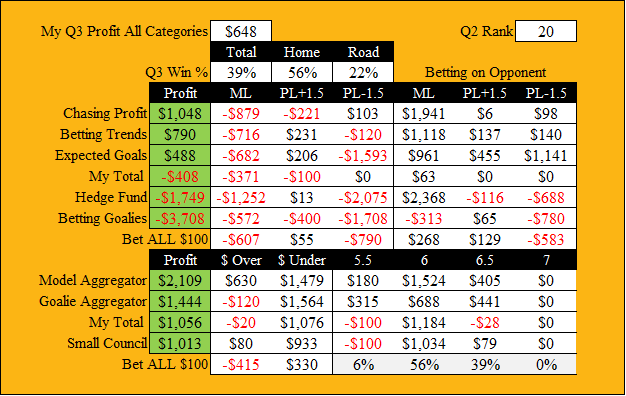
20) Anaheim Mighty Ducks, (-$370):
The Anaheim Ducks were actually good in the first quarter and lured me onto their bandwagon, but eventually the flock started taking fire and plunged back down the dirt in Q2. I produced a nice profit with this team in the both the first two quarters, one betting them to win, the other betting them to lose. After a nice run betting their opponents, they started winning again early in Q3, which caught me off guard. The team had a lot in common with the Ottawa Senators, they had the knockout power to beat any opponent, but a weak chin that elevated the risk of being on the receiving end of the knockout. Betting them to win every game produced a better return than betting them to lose.
This was a bad team for most of my models and over/under algorithms, so it makes sense why my own results suffered. If you bet $100 on Ducks to lose every Q3 game, you lost $183 on a team that won 42% of their games, but would have banked a nice profit betting their opponents -1.5 goals. That’s not how it played out for me or my models, who bet a suspiciously large amount of money on Ducks to cover -1.5 goals, which was the worst possible pick you could have consistently made with this team. It might be worth my time to run a diagnostic why my Chasing Profit fund sunk more than $2,000 into their least profitable bet (where’s the shrugging shoulders emoji).
21) New Jersey Devils, (-$372):
The Devils were once again without star player Jack Hughes for a chunk of Q3, which was difficult for them to overcome while also missing Dougie Hamilton (among others missing time). Goaltending plagued this team for the entire first half, until Vitek Vanecek elevated to decent early in H2, but then he was lost to injury and Nico Daws became the new #1, succeeding initially but lacking sustainability. If you travelled backwards in time to the beginning of the quarter with optimal betting instructions to crush your Devils bets, you’d be looking at “when they win, bet them to lose their next two, then bet them to win and repeat”. That was their quarter in a nutshell.
The final count was 45% at home, 30% on the road. They had a goals against average of 3.5 and a SV% at .885, but the expected SV% was .892, so that was not exactly a goalie friendly environment. It was reassuring to see my goalie models post strong results with this team, most especially betting them to lose. My starter predictions likely made little impact, given that all their options sucked. Despite the goalie issues, overs went 10-10-1 because the goal scoring dropped by half a goal per game while goals against stayed roughly the same. The Small Council managed to navigate that potential hazard for profit, helping me do the same. Jack Hughes can blame the goalies all he wants, but goal support was lower.
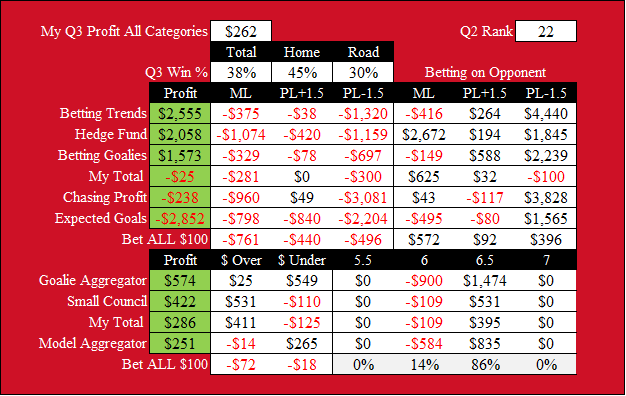
22) Calgary Flames, (-$390):
The exodus of players continued from the Calgary Flames, but trading Zadorov and Lindholm did not have an immediate negative impact. It cost me a few big bets after the Lindholm trade expecting this team would significantly decline, not go on a winning streak, which happened (though not long). The key component to whatever success they had revolved around the outstanding goaltending provided by Jacob Markstrom, who was also rumoured in trade negotiations. That was one piece holding the dam together, then Chris Tanev was traded near Q3’s end, then Hanifin. Clearly a full teardown is not on the agenda, but pending UFAs were shipped out, despite some fans surely yearning for a proper tanking selling everything possible.
Having watched a few Flames games late in Q3 (and early Q4), this team is buzzing. You can tell that the guys still there have every intention of chasing down a wildcard spot. Their 3rd period comeback win that ended the Penguins season was electric, for the Calgary players that was like a playoff game. There is a fire burning in Nazem Kadri. I don’t like that contract, but think he’s earning it in the current schedule. Calgary won 46% at home and 80% on the road, which is a potential betting hazard, but my models handled it fine. That helped me run profit on both sides, despite my prevailing belief that implosion was imminent, though watching their games provided sober second thought.
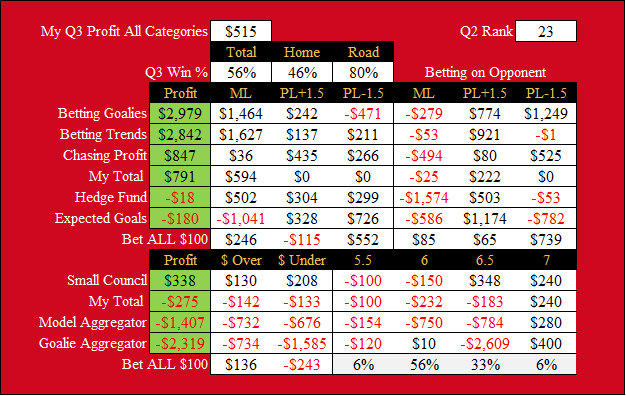
23) Philadelphia Flyers, (-$426):
The big Q3 news on the Flyers front was losing goaltender Carter Hart to criminal charges, and the team initially struggled in his absence. Samuel Ersson had been rock-solid when they were alternating starts in Dec/Jan, but hit an awful cold stretch that lasted until the all-star break. Whatever was ailing Ersson was fixed by a few days off. Maybe he took some yoga classes, went fishing, or spent time in the video room with the skills coach. Whatever he did busted the slump. They managed to hold a playoff spot for nearly the entire quarter (possibly from start to finish), but their betting lines were not priced accordingly as they were underdogs in more than 65% of their games.
When the ship began to sink in the immediate aftermath of Hart’s departure, my response was aggressively betting Philly to lose, which worked until the all-star break. It only took me a few games to figure out that Cinderella had simply gone for a pee break at midnight, and was back on the dance floor shortly afterwards. It does make some sense that my goalie aggregator lost a big sum on their over/under, considering Ersson went from awesome to terrible to good again. It’s hard to pull a profitable pattern from swings like that. Most of my models handled this team well, except the Expected Goals index which sunk far too much money into Flyers to win by at least 2 goals.
24) St. Louis Blues, (-$549):
The St. Louis Blues status as a middling team fighting for a wildcard spot did not change in Q3, but their winning % did climb from 48% to 55%. This was the second consecutive quarter of reliable play by Jordan Binnington, who won 8 of 14 starts, significantly exceeding expected save percentage. That’s partially responsible for 2-straight strong quarters for my goalie-based models, over/under notwithstanding. Their unders went 11-9-1 in Q2, then 9-9-2 in Q3, with my Small Council (and as a result me) suffering a big loss on both sides, with all the problems occurring in the 45% of their games where the total was 6.5 (where I went 2-9, including 4 max bets). Ouch.
The Chasing Profit and Expected Goals model indices were absolutely singing the blues betting them to lose. Betting their opponents -1.5 was actually the most profitable outcome to pick in Q2 (where both CP and xG turned a profit), so they can be excused for doubling down on that pick early in Q3. All the Chasing Profit models are making selections based on previous 30-day profitability, so it makes sense why the investment was made in the first place. Profit parameter flippage can be problematic if that’s what you’re pursuing. Granted, if you bet $100 every Blues opponent -1.5 goals in Q3, you only finished down $100, so those models collectively losing $7,000 isn’t entirely defensible.
25) Boston Bruins, (-$594):
The Boston Bruins only won 50% of their Q2 games, and I managed to post a profit both betting them to win and lose. Then they improved substantially early in the 3rd quarter (winning 8 of 10), and it took a minute before I fully grasped their resurgence (but got burned believing too strongly when they lost 4-1 to Calgary right after the Lindholm trade). Then suddenly the struggling resumed and they lost 7 of their next 9 games. I’m beginning to notice a disturbing amount of sudden trend reversals in exactly the opposite direction while compiling these team reports. They were really good, then really bad, then really good, seems to be a re-occurring theme. Boston was difficult to navigate.
Jeremy Swayman hit a rough patch in Q2, but was rock-solid again in Q3. Their unders managed a small profit (despite a few high scoring games) and my Small Council turned a profit while the goalie consortium were the biggest losers. This was among the easiest teams to predict who would start every game, because they mostly alternated back and forth (with a few exceptions, Swayman had 12 starts, Ullmark 9). The team had a .920 SV% in Swayman starts (with .908 expected) and .892 in Ullmark starts (with .903 expected). Apparently Ullmark may have vetoed a trade to LA, which was bad news for my fantasy team. Betting-wise, I lost over $2,000 in Swayman starts (equal parts betting him to win and lose) and profited $500 in Ullmark starts (mostly from overs and unders).
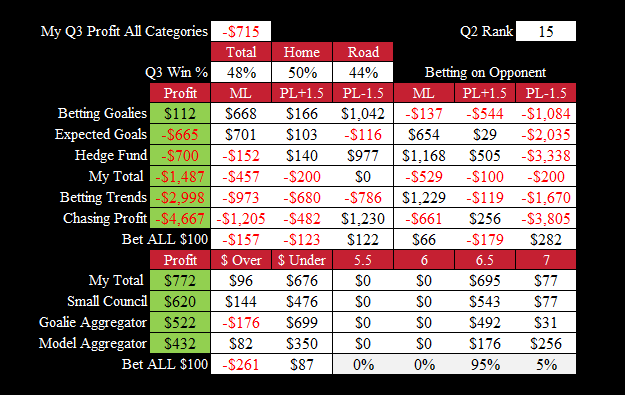
26) Toronto Maple Leafs, (-$705):
I hate the Toronto Maple Leafs. It’s in my bio, something I’ve considered tattooing on my forehead (maybe a cartoon bear wiping its ass with a blue maple leaf). They are 3rd last in my all-time profit ranks, which you might think is because my hatred compels me to bet their opponents too often. Nope, I’m down $9,000 betting them to win, and up $896 betting them to lose (I’m up $2,600 on their over/under). Technically in the current schedule, I had an awful first quarter then respectable ever since, so maybe recusing myself from Leaf picks isn’t necessary. But it often feels like my internal bias needs to be declared, especially come playoff time when I’m aggressively reverse jinxing.
The biggest factor driving that 70%-win rate was the super-human play of Auston Matthews, followed by Ilya Samsonov escaping purgatory to provide decent goaltending in the absence of Joseph Woll, who returned near the end of the quarter. The team had a .905 SV% in Samsonov starts (with .895 expected), so this was not a friendly defensive environment for goalies (it was .877 in Martin Jones starts). Their overs went 6-6 in Samsonov starts and 5-1 in Jones starts. My Hedge Fund successfully sunk significant money into Toronto moneylines because they were identified as over-priced. They have the largest fan base, and it is difficult sustaining profit betting them to win unless they are winning 60% plus.
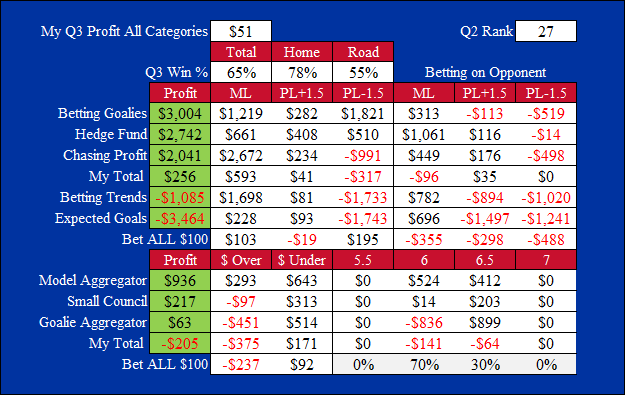
27) Carolina Hurricanes, (-$718):
The Carolina Hurricanes had a few bumps in the road early in the season when the goaltending was erratic and the offense couldn’t overcome that deficiency. Frederik Andersen was sidelined most of the season, Antti Raanta was bad enough that he was sent to the minors and cleared waivers when multiple teams needed a goalie, and Kochetkov sustained a concussion near the beginning of Q3. Once the goaltending settled down, this team settled into their status as one of the league’s best teams. Granted, that proficiency didn’t translate to betting profits for me because their lines are generally expensive, so the revenue from their wins is small and the cost of losses exacerbated.
The Betting Goalies index/aggregator were the only ones that managed a strong return, which makes sense intuitively given the differences between the goalies. Kochetkov started 9 games (where the team had a .926 SV%), Spencer Martin started 5 (.922), and Antti Raanta started 5 (with an .839 SV%). Freddy Andersen returned at the beginning of Q4 and Raanta was waived, so we may not see him in the league again this season. Hopefully that means it will always be safe betting Carolina to win rest of schedule, with one important pitfall removed from the obstacle course. My expected goals models were awful whether betting Canes to win or lose.
28) Chicago Blackhawks, (-$796):
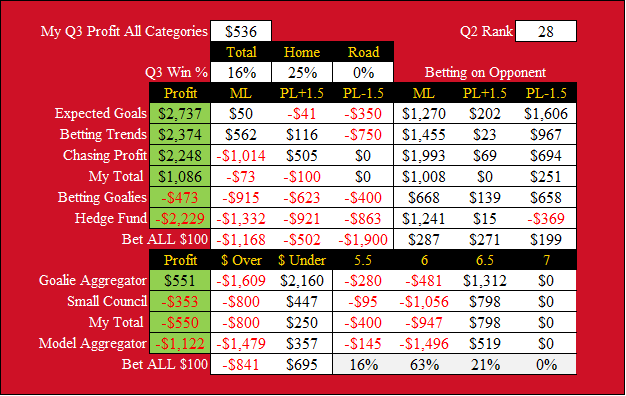
The Chicago Blackhawks played the first half of the third quarter without their prized rookie Connor Bedard, who did return earlier than expected from his broken jaw. In his absence, they played responsible defensive hockey, receiving quality goaltending from Petr Mrazek, who carried a heavy workload. They’d get more ping pong balls in the draft lottery mixing Soderblom into the rotation more frequently, but that does not seem to be the objective. Luke Richardson wants nothing to do with tanking. That’s too bad, because I love tanking, at least from a betting perspective. It would be more profitable if they were reliably awful, but pulling upsets out of their asses is problematic for bettors.
My models largely had a good quarter handling Chicago, with the exception of my Hedge Fund betting far too much on Hawks to win when they only won 16% of their games, including 0% on the road. That’s where my foot really pressed hard on the gas pedal, recognizing the difference in their output away from the home barn. Their unders went 13-5-1, yet several of my models/algorithms were tricked into betting far too much on their overs. It appears as though Soderblom’s 5 starts (where they had an .861 SV%) inspired too many bets on Mrazek overs in games that followed. The Goalie Aggregator didn’t have that problem.
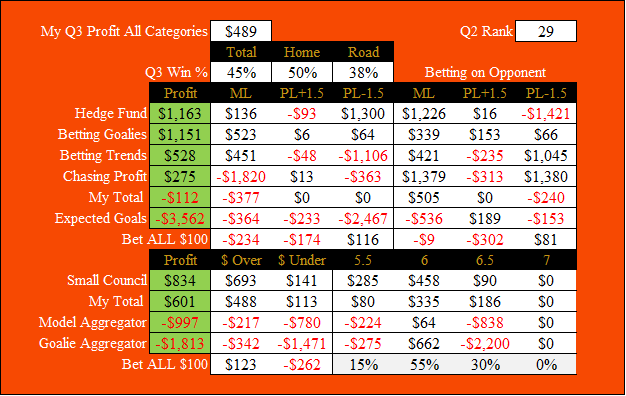
29) Edmonton Oilers, (-$1,073):
My ass was firmly planted onboard the Oilers bandwagon from the first day of the 2023/24 season, but lost a considerable sum of pretend money when that metaphorical wagon crashed into the ditch with Woodcroft at the wheel. But the sportsbooks never stopped pricing them like an elite team, which eventually they indeed became. They came within an inch of setting a new consecutive wins record, during which time my investment was overwhelmingly on Edmonton. Once the streak was snapped, they were decidedly less mighty, but still soliciting my selection more often than not. This was an excellent team for my models, so it was hard for me to screw that up when all my advisors were excelling.
Once that winning streak was snapped, Stuart Skinner fell out of Vezina form and began leaking oil. He still won 10 of 15 starts, but team SV% in those games dropped to .902 (with .892 expected). That expected SV% was higher in Pickard starts, suggesting either the team takes more risks with Skinner in goal, or Pickard just faces the weaker competition (probably a little of both). Edmonton might not have the international fan base of the Leafs, but they’ve been a very public team this year, at least going by line price. The Hedge Fund was regularly sniffing out negative value on their lines and picking it, which worked. Edmonton only lost 30% of their games, but a few of my models managed a nice profit betting them to lose.
30) New York Rangers, (-$1,134):
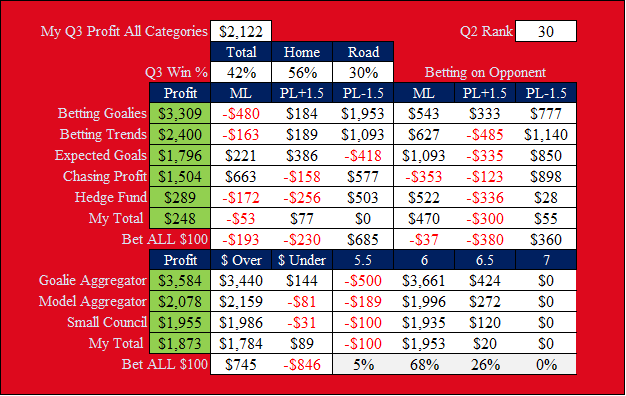
Trying to figure out the New York Rangers in the middle two quarters of the season was a tremendous challenge. Their Vezina winning goaltender was far from Vezina form for most of it, but they also have lots of skill on the roster, capable of beating any team any night. They lost games they had no business losing, and teams like that are difficult to trust. It was hard for me to navigate those shoals because the Rangers were by far the worst team for my betting models. As of Feb 14, they were collectively down $30,000 on an average bet size around $250. That’s not reflected in the graphic you see above, which represents new versions of several models.
Perhaps my model retrofitting project should not have erased their previous bad results, but since those no longer exist, I don’t want their data in my tracking. That’s not actionable intelligence. The Rangers climbed from winning 53% in Q2 to 65% in Q3, and the biggest reason was the revival of Igor Shesterkin, who suddenly sprung to life and caught fire. The team had a .917 SV% in his starts compared to .893 expected (both were higher in Quick starts, but he also drew easier opponents). My goalie index finished atop the leaderboard, wagering disproportionately on Rangers to win, since both options were delivering positive results. It didn’t necessarily matter who was getting the nod.
31) Columbus Blue Jackets, (-$1,242):
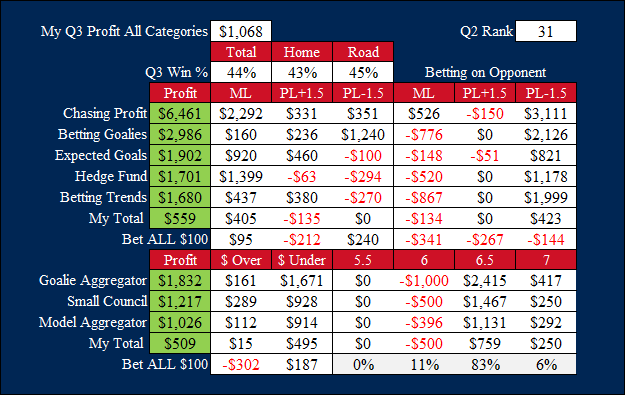
Most of the damage sustained by my Columbus Blue Jackets betting portfolio was sustained in the first quarter, with just a small loss in Q2. Once the 3rd quarter was underway, my new team of models had a pretty good handle on the optimal outcome, and it’s hard for me to struggle with a team my models are crushing (that seems to be a reoccurring theme). This team did have a tendency to pull-off some big upsets when I was heavily invested in their opponents, which impacted my earnings. Thankfully that was offset by over/under predictability with most of the revenue generated by unders (no thanks to their goaltending). My Goalie Aggregator was fantastic, especially betting Elvis Merzlikins unders (which went 7-4).
The starting goalie had a strong impact on my own results, performing excellent when Tarasov was between the pipes, and losing money for Elvis (who was the better of the two). Elvis had 11 starts winning 4, Tarasov won 3 of 7. The team won 44% of their games, and I finished with a small profit both betting them to win and lose. But they are down here in the basement of my profitability spectrum for a reason, making me less aggressive betting them to win or lose (on average anyway). They have skilled players on a roster that was designed to win. Despite the results, the previous administration was trying to make the playoffs with the offseason moves. It was just a flawed building project.
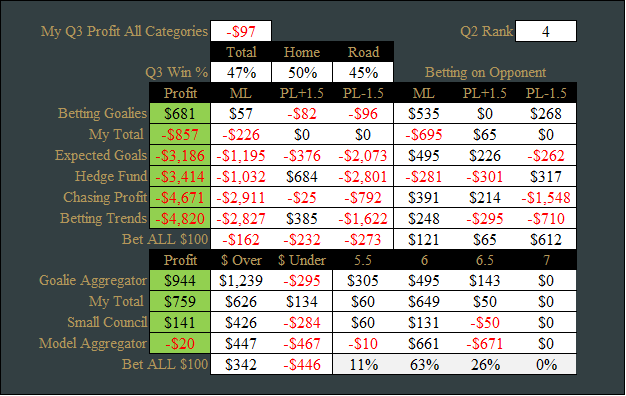
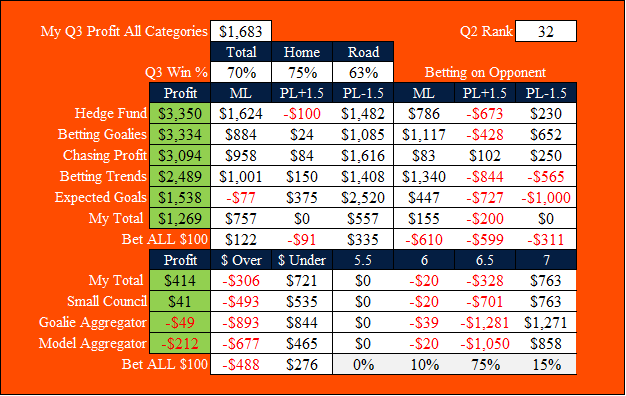
32) Detroit Red Wings, (-$1,694):
My progression betting my favorite team was similar to my least favorite (Toronto), awful first quarter, decent second quarter, but divergence came in Q3. It took me a minute to fully believe the new Wings were a legitimate contender to make the playoffs. I’m still on Team Tank, but evidently that ship has long since sailed away, with me left in the harbour yearning for a first overall pick. At least Yzerman’s savvy intuition landed Alex DeBrincat in exchange for a late first round pick that’s unlikely to score 40 goals anytime soon, but the need for elite finishers decreases when you have scoring depth spread throughout the line-up.
It was actually their over/under that inflicted the most damage to my Q3 betting result, not irrational optimism or pessimism as is my tendency as a die-hard fan (who has died hard since Datsyuk retired), with my final profit on wins and losses at $15. The over/under had some tricky variance, such that it would have been optimal to just bet the opposite of the previous game’s result. If the coin flips heads, next flip bet tails. Sadly, none of my models are trained to look for that type of pattern. In 17 games from Jan 23 to March 8, the OU flipped from the previous result 14 times. That streak is still going as I’m finishing this report, and once I’m done this sentence, this will be ready to proof and publish.