

Week 2 NHL Betting Report

Week two of the NHL season has been logged into the history books, though with my Betting Reports scheduled for Sundays to accommodate my work schedule, I’m considering the week wrapped Saturday night. Given that I’m back to work after hip surgery, there won’t be as many blog posts full of picks, but I’ll still be sharing just as many picks, possibly even more, you’ll just have to find them on social media. The Twitter algorithm doesn’t make that easy for you given I’m a non-payer repeatedly promoting a website, so maybe check my profile to see if there’s something new. Mon-Wed-Fri I’ll be running Twitter polls for best parlay combinations for Tue-Thu-Sat, mostly comprised of my favorite picks. Check the replies to those polls to find more of my picks. I’ll post the winners on Bluesky too.
Before we go any further, it’s time for my regularly scheduled obligatory *DISCLAIMER* it needs be noted that I’m not betting with real money. These are all fictional wagers in a spreadsheet. My mission is to engage in a mass betting campaign, picking a winner of every single game, every over/under, because it provides a complete dataset for macroeconomic analysis, which can be shared with you, shedding light on what worked and what failed. I’m also tracking the results of betting every outcome, to help me (and you) uncover previously unknown or newly emerging profit vectors. However, my sister has begun betting hockey based on my advice and I’ll be sharing all those picks with you.
My Weekly Profit: -$231
My Season Profit: -$550
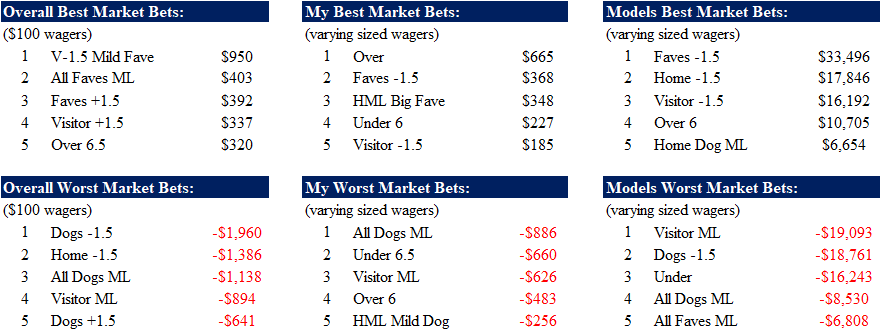
Underdogs were the big winners week one, but the advantage shifted back to favorites in the 6 days that followed. That was my primary reason for posting a loss on moneylines and pucklines, nearly making up for that loss with favorites and over/under. Favorites -1.5 goals was among the best categories this week, which sucks for me after pumping the brakes on those pucklines after a rough first week, but adaptation is the name of the game. This resurgence is good news despite my incorrect strategy course correction because my betting models love pucklines. If that demographic crashes for an extended (unexpected) period, some of my models will need some new marching orders.
Both my pretend wagers and my sister’s real bets are losing money through 2 weeks, but I’m not concerned. It’s very early in the season and many of my models still have small samples for their inputs and need to build up a larger track record before determining the best to tail. That’s why my sister has been making mostly $1 bets, waiting for more data before dialing up the aggression. My parlay polls were born last season after noticing that my rate of return was higher for my smaller bets than larger ones, where bet size is a proxy for confidence. I’m making 2 picks for every single game. If there are 20+ of those on a busy night, picking the best has proven remarkably difficult.
Maybe the answer is for my sister to start betting every single game. Make minimum bets 50 cents max bets $2. This is also why it’s better for me to share all my picks for a night instead of trying to choose favorites. Though I’m hoping once we are deeper into the season and models are playing with full samples, picking the best games will get that much easier. Let’s all keep our fingers crossed. Also, if any of my readers figure out a pattern to choose which of my bets are the best, please let me know what that is (respond in the comment section), unless of course me becoming aware of the pattern jeopardizes the sustained success. Then by all means, keep the secret to yourself.
Week 2 Results
When road teams were favored this week, they went 11-8, but covered -1.5 goals in 10 of those 11 wins. They went 17-2 on the alt puckline +1.5 goals, hence why favorites +1.5 cracked the category leaderboard this week (and why dogs -1.5 got hammered). Home -1.5 performed poorly, but dogs did the bulk of that damage. As a whole, home favorites -1.5 goals were only slightly below zero. My models crushed favorites -1.5 goals this week, nearly equally split between home and road. They did well with home dogs moneyline, but poorly on road dog ML. That was the part of their advice that dragged me down, buying too many dogs. But I also remember a betting report near Halloween 2022 when I joked about dressing up as a “big dog” for the holiday.
*Note* “Overall Market Bets” based on betting exactly $100 on every outcome. No alt totals for over/under.
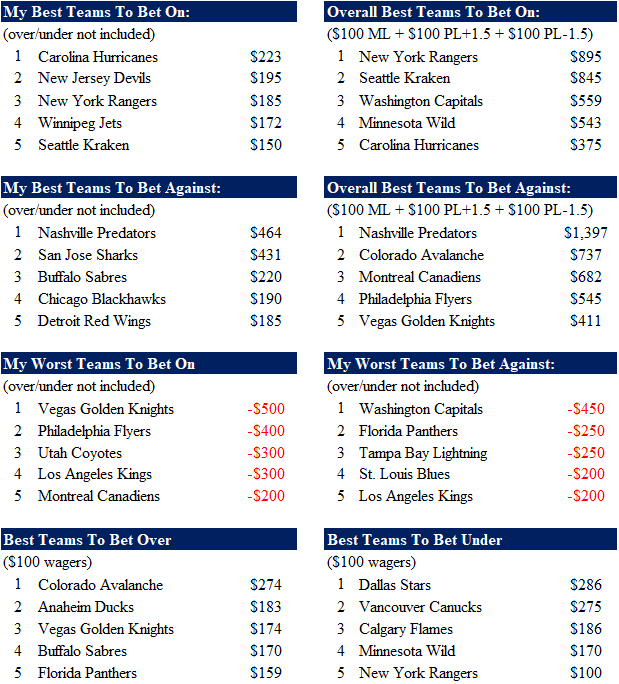
The 3 best teams to bet this week were the Rangers, Kraken, and Capitals, 2 of which made my best team list, which I’ll admit is a little light on profit. There was no one team that my wagon was exceedingly hitched to for wins, but performed well betting the Sharks and Predators to lose. Nashville should be decent eventually, but I’ll continue shorting the beast while it’s wounded, same with Colorado (though I have Colorado ML against San Jose Sunday). My 2 most costly mistakes were betting Vegas to win and Washington to lose, so best to log that into my short-term memory to avoid continuing down that path.
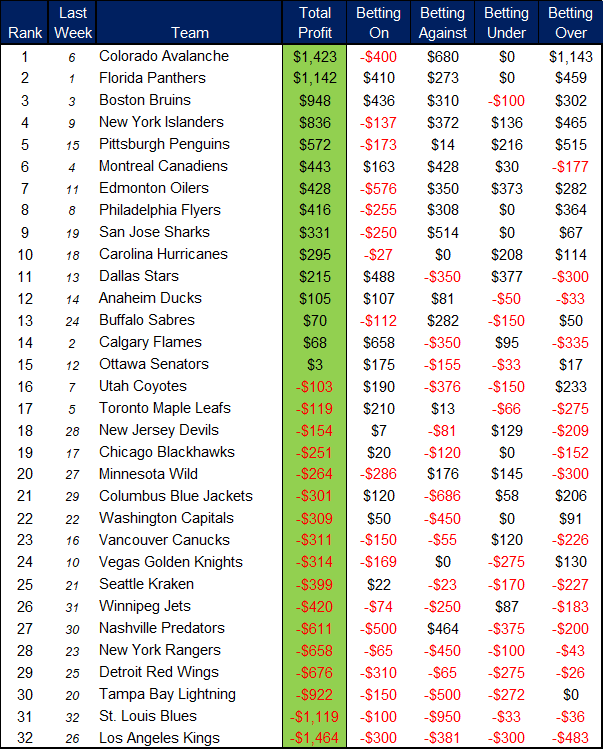
My Team of the Week: Colorado Avalanche, $919

The Colorado Avalanche climbed into top spot in my profitability rankings, thanks mostly to their overs starting 5-0. You could have joined me on that magic carpet ride if you caught my Tweet on October 12. Once Georgiev fell flat on his face out of the gate, it didn’t take me long to start betting their opponents. I actually had Vegas -1.5 goals in their first game of the season but that was only because of the home opener angle. That number would have been $200 higher had the Ducks managed to beat them in overtime. Still, Anaheim led for most of the game as a +210 dog. I do think eventually the Avs will get rolling, but they need to get healthy first.
The Pittsburgh Penguins were #2 on my best team leaderboard with a majority of the proceeds coming from over/under. Much like Colorado, I’m undefeated picking their over/under….sorry, they just tied up their game against Winnipeg 3-3, so my under 6.5 bet is a loser. That won’t be reflected in my bet stats until week 3, but at the moment that was written it was still true. I’ll leave it in. Figuring out their wins and losses has been tougher because it’s still unclear if they are good or bad. I performed poorly betting Pens wins-losses in week 1, but have improved since my betting models began influencing my choices.
My Worst Team of the Week: Los Angeles Kings, -$933
The LA Kings were my worst team of the week, and probably for my betting models too (my models are not currently included in my “teams” worksheet, but it’s on the “to-do” list). The Kings had been playing well with Darcy Kuemper posting a .948 SV% in the opening week. Then Darcy turned back into a pumpkin getting lit up for 8 goals against Ottawa and suffered an injury prior to the team playing on back-to-back nights. This elevated Pheonix Copley to back-up, and he sucked last we saw him in the NHL, but alas “Big Save Dave” was rolled out for starts on consecutive nights, pulling out the win (getting blown out by Toronto then beating Montreal).
My second worst team of the week was the Calgary Flames, mostly due to two lost max bets on over 6 goals, one against Chicago, the other against Seattle. Frankly whiffing on the Hawks bet should have put my guard up for their next game, but the models loved both those games, so much so that they were recommended to my sister, both losing. At least those games become data points for the next game, which will have a larger supporting sample. Calgary started 4-0 before losing to Seattle, but I’m still lacking confidence this will be a playoff team. At this stage, they’re a team I like as an underdog, but less as a favorite.
Team-by-Team Profitability Rankings
These profitability rankings are based on the sum of all my bets per team, including where the money was won or lost. Each week my new Profitability Rankings will be based on all the games in the season, not just what happened this week.
Betting Models Results
My picks are being guided by a roster of 40 betting models, half bet over/under, the others wins and losses. Below is a chart showing their results for week two. You can see how my picks performed relative to theirs.
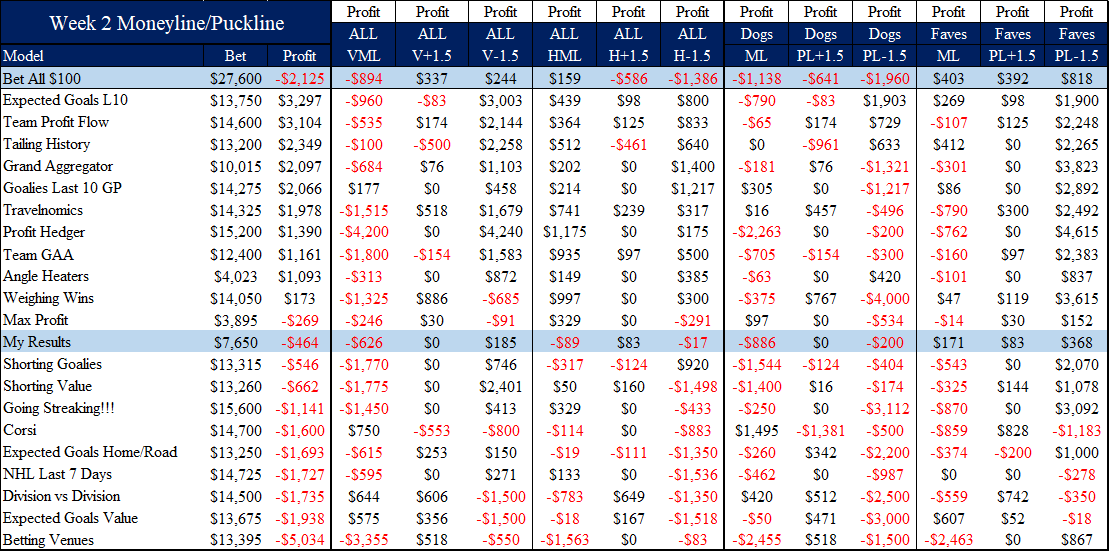
Looking at the table above just gave me an idea for a new model, which should be reasonably easy to build. It would be very similar to my over/under Profit Aggregator, which adds up the wagers only for models running a profit making that bet with these teams in the last 30 days. The new variant would only add up say “favorite moneyline” bets from models earning a profit from fave ML in the last 30 days. If a model is betting a dog but is bad at betting dogs, it does not get summed. The other sad bit of news is Shorting Value had a losing week, but still ranks #6 on the full season leaderboard.
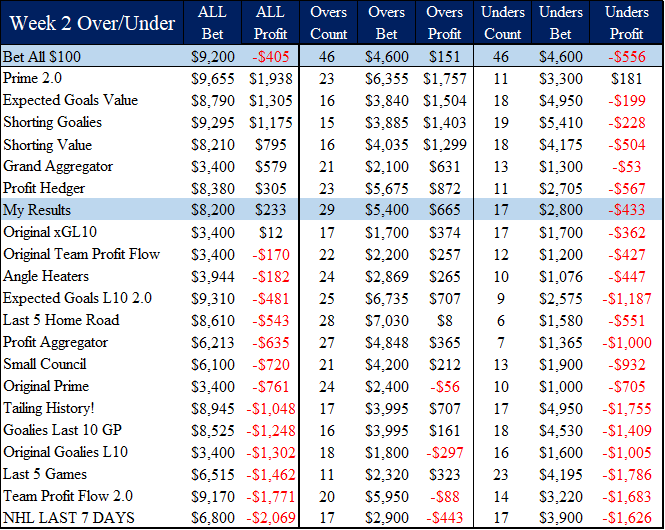
The basic summary stat from the last 6 days is moneyline/puckline models up $2,000 while over/under models lost $6,000 of pretend money. But the objective is not having 40 consistently profitable models. That would be an impossible task given that history does not always repeat in a predictable manner and trends can be subject to abrupt shifts in the opposite direction. The objective is harnessing the hottest models and tailing those who are working angles based on historical data that is repeating. In theory the more data these have, the more stable they’ll be. The hot starters may very well cool because they are thriving on that volatility.
For example, some of my models cashed big bets betting underdogs -1.5 goals because they were 2 for 2 on the visitor puckline +1.5 goals, and they have angles that look for dogs who are cashing more than 70% V+1.5 bets in the last 10 games. Yet once that bad team has played more games, they are less likely to be 70% or more. One bit of encouraging news is seeing the Grand Aggregator and Angle Heaters having a good week. This season I’m tracking how each angle within each model (1600 total) are performing, and Angle Heaters sums the profit of each model in the last 30 days working that specific angle, then bets the best.
Top Model Week 2: Expected Goals Last 10 Games
The top model this week was Expected Goals Last 10 Games (aka xGL10) one of my 3 models using xGF% as the primary input. Weirdly the other two had awful weeks. One model only counts road games for the visitor and visa versa for home teams. That one is currently running off smaller sample sizes than this one that uses a team’s last 10 games, both home and road. The third takes xGF% to predict what the line should be, then makes picks based on distance from the implied probability of the moneylines. It’s also one of my “value hedgers” and had a strong opening week before crashing in week 2. The strong performance by xGL10 included underdogs -1.5 goals (which otherwise had a terrible week), and equally well betting favorites -1.5. This one uses 5v5 xGF and is doing well betting visitors when the home E[xGF%] is less than 48%. The home/road version uses all strengths xGF.
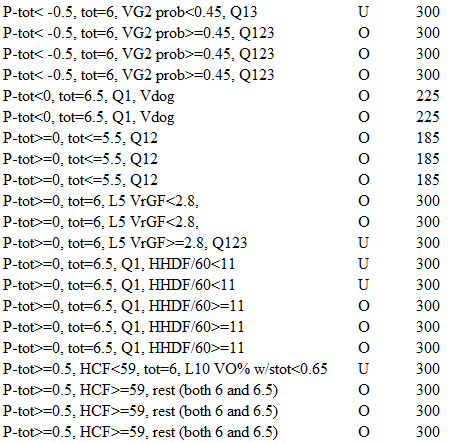
My top over/under model is simply going by the name “Prime” short for “Primary”. This one does not have a specific gimmick, but the primary input is average goals last 7 games minus max and min. However, it does not subtract the highest and lowest goal totals until a team has played at least 7 games, so that part isn’t factoring yet. For fun I’ll show you all the angles for Prime’s winning bets. It likes betting overs when the road team has a back-up goalie start probability >= 45% (as estimated by my brain each game) and the total is 6. When the input is >=0, the total is 6.5, home high danger chances for per 60 minutes is >=11, bet the over (but only first quarter of the schedule). Prime makes a majority max bets. Very aggressive. Shorting Goalies is still my top OU model on the season.
That’s the genius of how the spreadsheet is designed (sorry if that’s arrogant to say, but accurate), it’s super easy to see how every model is performing at everything, and exactly why they made all those picks. Which input variables are directly responsible for success or failure of the whole group?
Worst Model Week 2: Betting Venues
My 2nd betting model ever created has lost $6,000 through the first 41 bets, picking the incorrect outcome in 63% of those games. I’m not scrapping the model or even making changes yet, despite having the infrastructure to easily repair broken models during the season. The sample size is still too small to make any definitive conclusion about any of the models, but if my worst models can establish themselves as reliably bad, then there is fading opportunity. That’s why my pick graphics will show you were my top 5 models are invested, as well as the 5 worst (by last 30 days). These also have different instructions for different quarters of the schedule, so it could catch fire after a new quarter begins.
My worst over/under model was NHL Last 7 Days, which bets according to league trends in the past 7 days. The problem this mod encountered was a shift in what worked from week 1 to week 2. Under 6.5 was hot, then it flipped. Over 6 was hot then flipped. This model is a close cousin of Tailing History (aka Tails), who actually uses the NHL7 data as part of its calculation (plus/minus 7 days in the previous 2 seasons, and last 7 of the current). Tails crashed too, at least the over/under version. The moneyline/puckline version had a fantastic week, mostly on the backs of favorites -1.5 goals and is now counting among my 5 hottest models on the season.
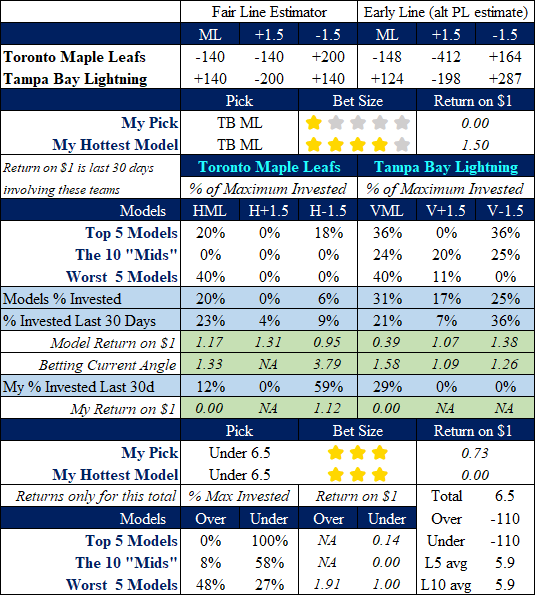
Tomorrow’s Picks
Alas we only have 1 game on Monday with a busy Tuesday, but the good news is that my pick graphics are ready to go, breaking down my model stats for every game. My models significantly prefer Tampa and my 5 worst models have a large stake on the Leafs ML. The problem is that they are not performing well betting VMLs in Tampa road games and Toronto home games. They are performing better -1.5 goals and my hottest models like that bet (my worst models have $0 on V-1.5), I’m just not brave enough to follow after watching Tampa lose to Ottawa last game. I’m nervous they might be a bad road team again. I’ll just put a minimum bet on the ML.
For over/under, my hottest models have a 100% stake in under 6.5 goals, they are just performing horribly betting unders when these teams have a total at 6.5 (most notably last Tampa game against Ottawa when they took a large position on under). These teams are averaging 5.9 goals per game this season, which is comfortably beneath 6.5. If the line moves to 6, the models may not endorse the over. When that happens, you can always tail my original pick on the alt total. Most books should let you bet under 6.5 if it moves to 6, just charge a more expensive price. My worst over/under models prefer the over, and they are actually doing well betting over 6.5 with these teams through 2 weeks.
Check back on social media throughout the week for more picks!
Good luck!