


NHL Draft: Probability of Top 6 Forward or Top 4 Defense

Welcome to my first NHL Draft post on Substack, rekindling an old passion of mine that hit a metaphorical iceberg after my first investigation into the probability of acquiring a top 6 forward or top 4 defense (by top 6 forward, I mean top 192 forwards in the NHL, not depth charting each team). That blog post in 2018 was at a stage in my own intellectual development where player compensation was already dwarfing the draft on my priority list. For years doing draft analysis, the concept of “above replacement” had not leaked into my draft analysis, treating every game played in the big show as special. Fourth liners often play important roles on winning teams, but it’s hardly a “precious” commodity. Every summer there are dozens of character veteran players hoping to fill that role at a basement price.
Contending teams can often lure veterans who already banked big bucks to accept considerably less than the best offer for a shot at possibly winning a championship. Options in the discount bin come in a variety of types, but reliable centers for your bottom 6 is a tougher hole to fill. Finding a quality center for your top 6 is even harder, especially at the draft table, so that differentiation needs to be clearly stated before proceeding. In that light, it might even make sense for a team to only draft centers and defense, because it’s easier to move a center to wing than visa versa. Granted, you don’t want to be a team who let Nikita Kucherov slip through their fingers because you wanted someone who played in the middle.
Not only did my NHL Draft spreadsheet receive an upgrade this season, but so too did my NHL trades spreadsheet. The objective is pricing the average return for any given asset on the trade market, including draft picks. For example, when a 2nd pairing defenseman is traded straight-up for a single draft pick, the average selection is 88 overall. This was done allowing for differentiation according to age, salary, contract status, rental, etc. Ergo; if you need a 2nd pair D via trade, the expected price is a 3rd round pick. Meanwhile, the probability of drafting a defender who will be “top 2 pair” in that range in 5 seasons is less than 10%. You can buy one right now for a 3rd, or wait 5 years for a small chance at hitting the dartboard from that distance.
What will a top 6 forward or top 4 defense cost on the free agent market? I’ve got that angle covered too, but spoiler alert; that’s where you are the most likely to overpay. The list of big name unrestricted free agents who win Stanley Cups is much smaller than you might think. Scott Neidermayer, Zdeno Chara, Marian Hossa are near the top of that list, but there’s also Brian Rafalski, Brian Campbell, Alex Pietrangelo, with most of the other prominent names re-signing to stay with the same team. In 20 years, that’s only 6 big names who signed with a new team in July and won a Stanley Cup (unless you count Niskanen as “big”) and 5 of them are defensemen. Elite top pair D rarely hit the open market and attract bidding wars.
Trade Value
When a 2nd line center is in a 1 for 1 deal getting a draft pick, the average selection was 63, and nearly half of those were rentals. The selection needs to be 25 picks earlier to get a 2nd line center in lieu of a 2nd pair defense, while a 2nd line winger is almost exactly the same price as the 2D (a #1 goalie is in the same range, but those trades are also uncommon). The large majority of draft picks exchanged for top 4 D, top 6 F are selections in there first 3 rounds. Below is the first graphic shared from my NHL trades spreadsheet, looking at trade returns when one the assets in question is shipped out as the only asset in the trade (to isolate the precise return of that specific thing).
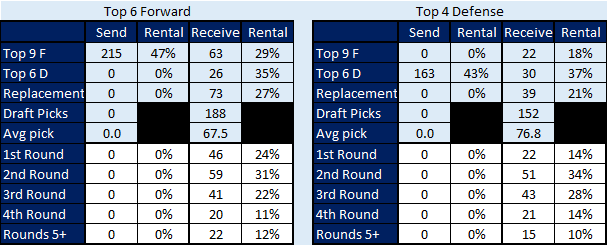
I’m sure future versions of this stat graphic will be much more detailed, certainly in terms of detailing the different types of packages coming back the other way. As mentioned before, I can isolate 1-for-1 asset swaps such that average draft pick is the value when only a single pick comes back. In cases where a prospect and a pick are coming back, the round of the pick is surely less on average (and yes, I can differentiate between those, this is just a work in progress). The evidence presented in stat graphic 1.0 above shows that top 6 forwards solicit a higher price on the trade market, but that’s entirely because of the cost of acquiring centers.
Looking at the trade market, my trades database has 215 deals where a top 6 forward was the solo asset being shipped out. Coming back were 41 top 6 forwards,15 top 4 D, and 188 draft picks (46 R1, 59 R2, 41 R3, 20 R4). There were also 35 players under age 22 who were formerly drafted in the first two rounds. One curious fact I did not anticipate was a lower ratio of first round picks for a top 4 D. I’m still brainstorming the best metric to use in quantifying trade return, but expected free agent value remaining under team control will be the primary for players. Grading trades for biggest winners and losers is the endgame, but that’s a complex grade to crunch, requiring development of several summary inputs.
Probability of Landing Top 6 Forward or Top 4 Defense
Recent upgrades to my draft spreadsheet make it easy to estimate future free agent value of picks, but it might be necessary to discount years far into the future, because getting a $6M player next season is far different than $6M summed across 7+ years. Getting one year of a $6M player is better than 10 years at replacement level. The table below displays the extreme difficulty staffing the top half of your line-up outside the first round, especially if you need help in the next 5 years. The ages below are the key milestones in contract development, as age 20 is when a majority of prospects turn pro, age 23 is likely year one of their 2nd deal, then 27 is unrestricted free agency.
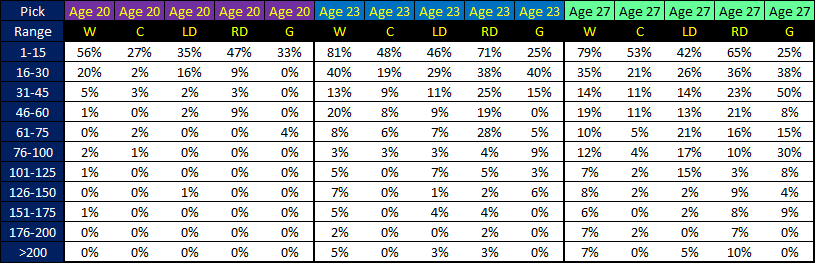
One note on the table above, some of the goalie samples are small, like the 50% for goalies picked between 31 and 45, which was only 14. Those included names like John Gibson, Jake Allen, Jacob Markstrom, Tristan Jarry, and Ondrej Pavelec. Only one of those 50% made the playoffs in their age 27 season as that team’s #1 starter and Pavelec’s Jets were swept by the Ducks. Let’s not look at the data and decide that goalies are slam dunks in that specific pick range. The skater data has substantially larger samples, and it’s remarkably difficult to find a center for one of your top 2 lines outside the first round.
Even if you only need a 2nd line center, the 2nd round only provides a 10% chance by age 27 and in the top 15 picks it’s basically a 50% chance, compared to 80% for wingers. Over the years there have been many head scratching “how did player X get drafted before player Y” situations where teams had desperate need at that position and made a pick judged harshly by historians. In the 2nd round, it is right-shot D that give you the best chance at a defender for your top 2 pair than a top 6 forward, but that’s only because teams want/need a certain number of right shooting defensemen and limited supply increases demand.
Right Shot D
Specifically on the right shot D subject, there’s an advantage for D to have their strong hand at the top of the stick when defending, hence why so many D shoot left despite being right-hand strong. Strong hand on the bottom provides an advantage shooting. That’s why pro golfers only shoot left if they are left-handed. Yet when you’re trying to hold the blueline in the offensive zone, it’s harder on your backhand. That’s one of the biggest reason teams want a right shot on the right point. There are some lefties who are proficient at playing the right side, but that generally takes a higher skill level and awareness to overcome those obstacles.
Any current or future GMs reading this, remember that correlation doesn’t always equate to causation. Just because right shot D have a higher home run rate in a specific range, doesn’t necessarily mean drafting one in lieu of a much more talented left-hand defender won’t blow up in your face years later. Most of the potential mistakes that the table above can inspire would happen in the early rounds. Once you get into the 2nd half of the draft, you’re basically throwing darts at a dartboard (assuming you’re a novice, not an expert), but in a range where history will judge less harshly.
Conclusion
Despite becoming an advocate for contending teams to trade picks for immediate help, I’ve wondered why teams like Tampa don’t at least demand a later pick coming back in each trade shipping picks out. If you’re going to have a fire-sale moving all your picks in the first 4 rounds, why not insist on getting a 6th or 7th coming back in each of those? There is a strategy to maxing bullseye probability later in drafts, one being drafting players with incredible talent but an obvious flaw or perceived deficiency (most commonly skating) then coaching them to correct/overcome that flaw (like Mark Stone). Worry about staffing your bottom 6 in July-August.
It might seem strange that my first blog post returning to draft punditry is arguing that draft picks are overvalued on the trade market and that you might be better off trading them all if you’ve already got elite talent at the key positions. That’s not really “setting the mood” for future posts on this subject, and probably casts confusion on why this passion of mine was re-ignited. Last year my nephew was selected late in the OHL draft, one of the top feeder leagues for NHL talent. Granted, his probability of getting even a single game in the big show is maybe 3% at best, but his probability of getting a scholarship to play NCAA hockey is substantially higher.
My old draft spreadsheet (updated recently with fresh data dating back 20 years) has several ways of maximizing that 3% probability and choosing the optimal path to get a free education and play in a very competitive league that produces a tremendous number of professional hockey players. It certainly doesn’t make sense paying a hundred grand for an education that could be rendered obsolete by artificial intelligence before graduation. My next blog post on the draft will likely be about the NCAA, which seems to be undergoing an evolution towards older players. That’s why I’m copy-pasting year-by-year stats for every forward who played an NCAA game in 2023/24 to chart their path to college.
It has occurred to me recently that it might make more sense for my own career development to flip the focus of my draft/contract analytics from helping teams maximize value to helping players maximize the probability of a pro career and banking the most money possible. My own earnings potential might be greater sending data to player agents with advice for their clients rather than pursuing NHL employment. Though in all likelihood, my maximum earnings will likely be found within the gambling sphere. Even if no sportsbooks offer me a job, I’m getting close to capable of earning a living betting on hockey. Still, it’s very satisfying to have this many passions fueling my fire. My own path has a variety of options to attain prosperity.