


Drafting Elite NHL Offensive Defensemen

The NHL Draft is one of my dormant obsessions, that consumed hundreds of hours of my youth, through University into adulthood. This evolved into fancy spreadsheets that can break down all aspects of draft math, including developmental paths, connecting all the many feeder leagues to the National Hockey League. Where the fire burning in my soul to chart optimal paths to the world’s best league began cooling was investigating the probability of drafting a top 6 forward or top 4 defenseman. Instead of treating all those who made the show as home runs, are they better than what’s available in the discount bin every summer? Younger me ascribed far too much value to average/replacement level talent.
My nephew getting drafted to the OHL re-ignited my interest in developmental paths, more to help attain NCAA scholarship than getting to the NHL. He was a late OHL pick, so his probability of NHL draft selection would have been less than 3%. That’s just a guess, but a highly educated guess. Last summer I even copy-pasted the year-by-year careers of everyone who played for one of the top 40 schools in 2024 to figure out the ideal ladder to climb from Ontario junior B to NCAA. But before he had the chance to commence climbing, the NCAA changed the rule excluding CHL players, which tainted all the “career path math” preceeding the change. That ostensibly made it harder to get a spot in either league, now all the high-end players can play both, CHL younger, NCAA older.
My nephew’s chances of getting a scholarship virtually vanished overnight, with hundreds of previously disqualified players suddenly eligible to play college. One of the first findings copy-pasting all that NCAA career data last summer was the average age being far higher than expected, with a big chunk of the league 22 to 25. My dad went to Yale and my nephew has the grades, but the hockey team wouldn’t even want him enrolling for another 2-3 years (he just graduated high school). This trend began prior to the rule change and maybe even sparked the decree. We’ll see what lasting impact this has on the previous NCAA feeder leagues, but in theory American/Canadian junior leagues will be the biggest losers. The BCHL and USHL particularly.
This might actually simplify where to find top 4 defense at age 17, but this blog post is taking it a step further to look at what I’m calling “blue-chip offensive D” and where to find them. Lane Hutson is the latest inspiration, so for this I looked at D drafted from 2005 to 2018 and the next 5 years after being drafted. If they played >50 GP with >30 PTS per 82 GP, they were labelled blue chip, followed by some manual tweaking to ensure legitimacy. The narrow 5-year window permitted more picks to be included. Prospects who played less than 20 games in their first year of draft eligibility were excluded. There was a shade under 1000 defense drafted in that window, 58 of them qualified as blue-chip.
Lane was the inspiration for this, but he scored 60 PTS at age 20, the youngest 60-point season in the salary cap era. Quinn Hughes and Erik Karlsson are the only ones to accomplish that at 21. Only 5 reached that milestone at age 22. So your probability of drafting a D who hits that offensive number at that age is at least 1 in 1300 if you’re looking at just the cap era. He was drafted at the end of the 2nd round because he was 148 lbs, but playing USDP, so a high profile player above point per game at that level. Setting out to find the next Lane Hutson is an impossible task when there’s only been one in the last 20 years. Okay, technically Cale Makar scored 50 PTS in 57 GP at age 20 and was point per game at age 21, but those were Covid shortened schedules. Makar is further along the unicorn scale.
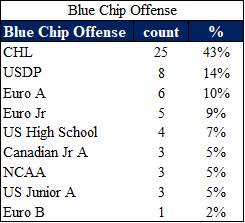
I’m not hunting unicorns here, so we’ll set the bar much lower at 30 PTS per 82 GP and your probability of getting one of this before age 23, which turned out to be approximately 6% of the sample (including Makar). If Hutson was 2 inches taller and 20 lbs heavier in his draft year he would have been picked top 5 like Makar. Before we investigate where to find the scorers, let’s look at where to find defensemen, with 44% coming from the CHL. The only 17-year-olds in the NCAA are rare and exceptional talents, but 31% of drafted defensemen come from the main NCAA feeder leagues (or at least pre-rule change). Anyone with a chance of getting drafted will boost their stock more in CHL than high school or USHL.

The rule change might even substantially reduce NHL team scouting budgets, because there’s lots of small towns in the middle nowhere they won’t need to visit nearly as much. There are certainly places like Minnesota where high school hockey has a rich tradition and will always attract high-end local talent. When we look at the sources of the blue chip talent, CHL once again dominates the competition, while lesser junior leagues and high school provide fewer. USDP and and top European pro leagues are #2 and #3, main reason being it’s really hard for 17-year-olds to make those rosters. You rarely see 17-year-old D in the KHL. Sweden/Finland more, but also more that never reach blue-chip NHL status. The #2 source produced Lane Hutson.
In terms of calculating probability at any given pick, it’s more complicated than just counting the actual numbers because from 2006 to 2018, there were only 1-6 defensemen taken at any given pick. There’s also much more in the middle of round one than the top, so clusters at various picks can produce a higher probability than earlier picks. My modelling assumes decreasing probability with each pick, because all those mid-first rounders were available earlier. Sometimes there’s a bumper crop of forwards that push D farther back in the order, but often teams prefer the forward earlier because there’s a lower strikeout rate. The dominating 17-year-old offensive defenseman is more likely to lack the brain/tools to defend at the NHL level, which can have dire consequences if you play them regularly even strength.
The chart below illustrates the probability of home runs or strikeouts in a 5-year window. Worth noting; the biggest names among the D “strikeouts” who “bloomed” later are Devon Toews, Vladislav Gavrikov, Matt Roy, Ryan Graves, Carson Soucy, then drops off to Derek Forbot. Pretty much every other whiff was close to replacement level for the rest of their careers. Whereas the weakest home runs are Ty Smith, Calen Addison, Patrick Wiercioch, and Will Butcher, who all produced some offense early, but evolved into far below blue-chip status. Still, had the bar been raised higher, the probability of hitting a so-called “home run” would have been even smaller. The chart for elite offensive forwards would not be much different, except likely a gentler slope mid-first round.

If you’re drafting a defenseman 1st overall, you’re pretty close to 100%; Rasmus Dahlin, Aaron Ekblad, Erik Johnson (who did produce more offense at a younger age), and Owen Power. That probability drops to 30% by pick 10, and below 10% by pick 28. The strikeout rate climbs rapidly until pick 40 where it hits 70% then flattens. If you’re an NHL scout and the analytics department is trying to find a Lane Hutson late round 2, early round 3, other examples of small D who excelled in the NHL are Letang, Fox, Dunn, Girard, Montour, but for every home run, there was more than 10 strikeouts. It’s far more likely the perceived flaw (or lack of exposure like Montour playing jr B) that dropped them in the draft order eventually torpedoes their NHL career.
You’re starting to see why my obsession with draft math cooled after discounting replacement level players. This is a copy-cat league, so next time there’s a 150-pounder leading the UDSP defense in scoring, he probably won’t drop to the end of round 2. Instead that player will start drawing comparisons to Lane Hutson, and as that narrative spreads among the scouting community, demand for that player will inevitably increase. Blueliners like Quinn Hughes and Adam Fox have helped reverse the bias against small, puck moving D, but there aren’t many in that mould leading teams to Stanley Cups. Kris Letang might be the best/only example in recent history, but Quinn Hughes would get eaten alive by Florida playoff forechecking.
My next post on the NHL draft coming out in the next 1-2 weeks is about the price/effectiveness of trading up or down in the draft. The primary motivation for this draft post is making use of a spreadsheet that took many hours building, and the next one dusts off my NHL trades database, taking 123 draft pick trades from 2006 to 2019, mostly 2 for 1 and 3 for 1 deals with one team trading up, the other adding picks to move down, and totaling how many NHL games that pick eventually produced. Preliminary analysis showed 54 times the team trading up for more GP, the team adding picks won 53, and 16 both got zero. Next post in the queue (but maybe not this summer) is what picks can buy on the trade market. As a math nerd, I’m more receptive to the trading all your picks strategy like Tampa than hoarding them like Arizona Utah. Sorry if this upsets my fellow draft geeks…
